Annals of Mathematics and Physics
An analysis of ammonia synthesis by the model of Selective Energy Transfer (SET)
Ragnar Larsson*
Cite this as
Larsson R (2019) An analysis of ammonia synthesis by the model of Selective Energy Transfer (SET). Ann Math Phys 2(1): 038-050. DOI: 10.17352/amp.000008The SET theory implies that energy is transferred from the catalyst system via infrared radiation to the molecules that are supposed to react. In previous investigations it has been demonstrated that the activation of the reacting species-as long as the molecules are infrared active-can occur at low adsorption strength. However, for molecules that are IR inactive, e.g. dinitrogen, this is not possible. Hence the N2 molecule has to be adsorbed on the catalyst surface to give rise to vibrations that can interact with IR quanta of the catalyst. By analyzing the activation energies for a series of reactions between hydrogen and nitrogen under slightly differing conditions this critical vibration has been found at wave numbers such as 374, 374 and 355cm-1. The critical vibration is identified as the degenerate bending vibration of the M-N-N unit. When this bending is activated, the N2 triple bond is weakened and makes place for hydrogen addition. Two different routes of reaction are scheduled, of which one is the most likely one, using the metal-atomic nitrogen stretch vibration as the catalyst vibrator.
For the classical Fe3O4 a perfect resonance (1:1) with the above-mentioned critical vibrations exist. This is also the case for the catalyst from Co3Mo3N, where a surface cover of, inter alia, MoO42- seem to act likewise in full resonance.
Introduction
The basic idea of the SET theory is that energy is transferred from a molecular vibration of the catalyst system (traditionally wihin the SET model designated as ω) to a vibration of similar frequency in the reacting molecule (designated as ν) [1]. The condition for such a transfer of energy is that a state of resonance holds between the two systems. The rate of energy transfer form one vibrator to another in a damped, coupled oscillating system was calculated in classical physics [2a]. Let ω and ν be the vibrational frequencies for the two vibrators, respectively, and if P is the energy transfer between the two systems per unit of time and Pres is the rate when there is a state of resonance, then the following relations were deduced:
R = P/Pres
and
R = ((ν2–ω2)2 Q2 /ω2ν2+1)-1
Where Q is the so called quality factor; Q = ν τ, with τ = the relaxation time.We take this rate P–after making appropriate integration over all possible ‘quality factors’ and after freshening it up to quantum standards-to equal the rate of the chemical reaction.
Presentation of formulae
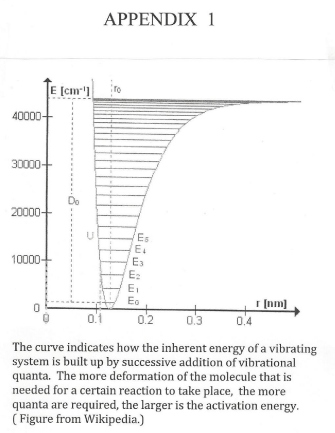
The quality factor (Q) is a measure of possible ways for the excited system to lose energy. Especially in heterogeneous catalysis there is a multitude of ways by which this can happen and we consequently integrate the rate expression from Q = ½ to Q = infinity [2b]. The SET theory has recently been summarized [1]. It holds that the activation energy (enthalpy) is built up [3], by a certain number of vibrational quanta related to the ν vibration. (Vide Appendix 1). This can be expressed [1], as a second order relation between the activation enthalpy and the vibrational quantum number n:
∆H# = M0 + M1 n + M2 n2 (1)
The second order term corresponds to the anharmonicity of the system and shall consequently have a negative sign. The coefficient of the first order term describes the wave number of the ν vibration. M0 indicates the state of adsorption of the reacting molecule. In most cases reported before [1], M0 as well as M1 and M2 is defined by the eqn (1). M0 is very close to zero, indicating that the activation occurs in a molecule loosely bonded close to the catalyst surface (for reaction with the other reactant available at the surface). In this way the molecule can better keep its state of activation than if it were strongly bonded to a solid surface.
It must be strongly emphasized that it is not the frequency value per se, that the catalyst might show, that is of importance in the SET model, but the agreement of one such a catalyst frequency to one (similar) frequency of the reacting molecule that is of importance. In this way energy might be transferred from the catalyst (i.e. the environment), to the reactant molecule.
Furthermore, as has been pointed out previously [1], the ratio ν/ω might be 1:1, 1:2, 3:2 etc. as long as, e.g., the products 3ω and 2ν describes the same (or nearly the same) amount of energy that might resonate to and fro the two vibrating systems.
Requirements for the testing of SET
In the present paper we will test the use of SET to describe the reaction of N2 with H2. The free molecule N2 is, however, infrared inactive and can therefore not be activated in the way described above. Only if N2 is adsorbed to a catalyst surface, a system M-N-N is created, even ever so feebly, where vibrations can be found so that the dipole moment varies during the change of interatomic distances, i.e., the vibrations are IR active.
This classical reaction has during later decades been treated under the assumption [4], that the dissociative adsorption of N2 is the rate determining step. This assumption has led to complicated treatment of the resulting system. Therefore it is interesting to test the SET approach, giving a simpler role for the catalyst.
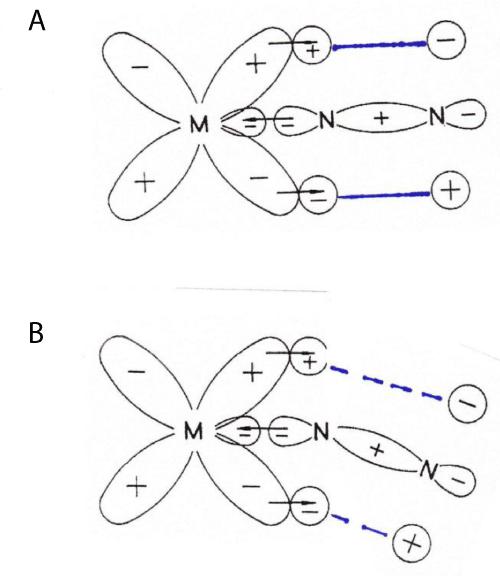
In Figure 1A we show a schematic description [5], of the bonding in the M-N-N unit where the π bonds between the 2p orbitals of the nitrogen atoms are indicated by heavy, blue lines.
The number of possible vibrations of this three-atom linear system is 3*3-5=4.
Of these four vibrations, two are stretching ones, of which one is well-known from coordination complexes, i.e., the asymmetric one at about 2200cm-1 [6] and the symmetric vibration with a feeble absorption at about 400cm-1 [6]. At least the high frequency absorption has been found for N2 adsorbed on a metallic surface [7].
The high absorption intensity of the asymmetric vibration is connected with a considerable difference in atomic charge of the two nitrogen atoms that is well described by XPS (ESCA) [8]. The low intensity of the symmetric vibration relates to the situation that the N2 group is here acting as a unit vibrating towards the metal atom. In neither case is the π bonding, giving rise to the triple bond of the N2 unit, broken. Therefore, there is no chance for a hydrogen atom to interact with the N(2p) orbitals to form an N–H bond.
The two remaining vibrations are bending ones in the z-x and the z-y planes, respectively, where ‘z’ represents the length dimension of the linear molecule. The two vibrations are degenerate, designated as Eu, with frequencies just over the M-N2 stretch [6], e.g. [M(NH3)5N2]Cl2 where M = Ru or Os. In Figure 1B the bending of the molecule is indicated, still using the same scheme as in Figure 1A. First, one notices that the partial break-down of the 2p-2p interaction will result in a charge redistribution across the molecule during vibration. The Eu vibration will therefore be IR active. Secondly, one can conclude that the outermost 2p orbital will be able to accept bonding with a hydrogen atom. This will completely ruin the π bonding and open up also the 2p orbital of the N-atom nearest to the metal atom for engaging a hydrogen atom. This results in an N2H4 unit, where much of the s orbitals of the two nitrogen atoms are engaged to form sp2-like orbitals. By this process the sp character of the bonds in the z direction will disappear, thereby weakening the M-N and the N-N bonds. A further attack from hydrogen atoms will easily result in the formation of two ammonia molecules (with sp3 orbitals).
Depending on the structure of the catalyst, it will be more or less easy for the hydrogen atoms to reach a suitable position for attacking the excited nitrogen molecule. If it is difficult, the degree of distortion of the M-N-N unit must be considerable and the activation energy will be large. (Cf. Appendix 1). In contrast, if the hydrogen atoms are well placed, the number of quanta needed for the distortion will be small and the activation energy consequently small. Thus the activation energy of the reaction will depend on the structure of the catalyst.
In the following this reasoning will be tested on activation enthalpies using experimental data from literature.
Strategy for the testing of SET
This text implies the use of collation of data reporting activation energies, and n (quantum vibrational number). In order to use eqn (1) - to get the quantity M1 – one must know the quantum number n. This process will be derived in the next Section.
Once we know ‘n’ for any of the catalysts, then eqn (1) can be used to give M1 and consequently, the vibration frequency by transferring it from kJ/mol to the unit cm-1, vide eqn (5b). In this way, the ‘critical vibration’, ν, is found, one value for each group of catalysts (in this paper there are three such groups) and three values of the frequency ν). Thereafter it remains to find the corresponding value of the catalyst vibration. This problem is further discussed in “Searching for resonance” (p-046).
Results
Fe/rare-earth intermetallics
The first test will be performed on a series of iron-containing rare-earth intermetallics cited from table 3.4 by Aika and Tamaru [9]. That table also contains data for cobalt compounds, but those data have been omitted here as the range of the measured data was not as large as that for the iron compounds Table 1.
The data are given in Table 1, where the treatment is closely following that of the “Concluding Remarks” [1], as follows:
∆H#, the enthalpy of activation, is formed as Ea expressed in kJ/mol minus the term RT, with T representing a mean value for the temperatures used in the investigation. (The RT term is a small correction of the term Ea and there is only a feeble variation in T).
Searching for the vibrational quantum number, n
‘Diff ∆H#’ in Table 1 stands for the difference between two succesive values of ∆H# in absolute numbers. For everyone of these differences we apply a number that seems to be common for all the data of the experimental series, the ‘common factor’ (CF) and seek the number of times (that we call n*) that CF is appearing in the diff ∆H# data.
(In the present example we have applied CF = 7 and n* is defined by the relation diff ∆H# = CF n*) (2)
(Where n* is shortened to the nearest digit)
In order to obtain a reasonably good value of the CF we form the sums of columns four and five, respectively, and form the ratio between the first sum and the second one. In the present case this ratio, E0 = 7.03 kJ/mol. In the SET procedure, ∆H# is supposed to be built up by a number of vibrational quanta, provisionally represented by E0 [1],
∆H#= n E0 (3)
The vibrational quantum number n for each of the sets of data, is found, from
eqn (3), by forming ∆H#/E0 which quantity is shortened to the nearest digit, i.e. ‘n’, Column 7. This is the best possible value for n. It is used for plotting ∆H# as a second order function in n, according to eqn (1) Table 2.
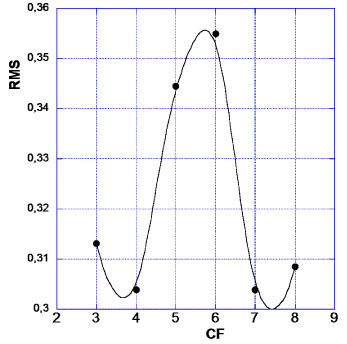
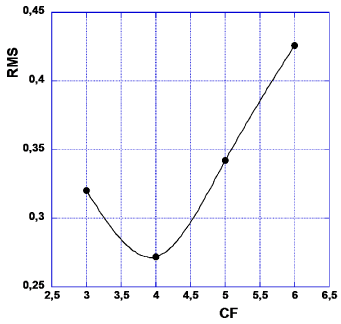
Now, how to decide about which of the applied CF values (CF = 3-8) that is the least CF, i.e. LCF? We suggest here to accept the smallest of those CF values for which one obtains the smallest outcome of RMS of ‘abs (diff n)’ as stated in the last column of Table 1. RMS stands for the statistical term of ‘root mean square’ of the numbers in each set of data analogous to those of Tables 1,2. Thus the value of CF that corresponds to a minimum of the RMS values, will be chosen as the LCF. These deliberations are illustrated in Figure 2. Furthermore, as (CF = 4) < (CF = 7), i.e. in order, we arrive at LCF = 4 (Figure 2).
Searching for the frequency of the ‘critical vibration’, ν (Figures 3,4 Table 3)
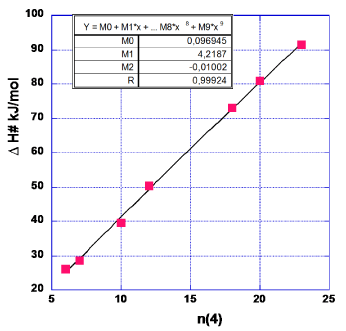
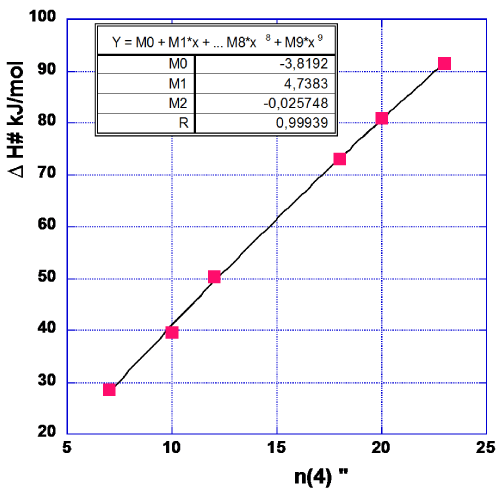
The data forming the graph in Figure 3 are arrived at in the same way as described for CF = 7 in Table 1. The data relevant for Figure 3 are given in Table 3. One notes that the first (lowest) data point is somewhat of a ‘dark sheep’ as the n-value might almost equally well be 7 as it is now taken to be 6. As this point is positioned at the end of the series of data it might give an erroneous value of M0. Therefore, we have drawn another graph (Figure 4) excluding this data point. The values of M0, M1 and M2 for this choice are given in the Figure 4.
In order to neutralize the above mentioned difficulty in chosing the proper value of n, we form the mean value of M0, M1 and M2 with data from Figures 3,4.
M0=½ (0.097–3.819)=-1.86 kJ/mol (4a)
M1=½ (4.2187+4.7383)=4.479 kJ/mol (4b)
M2=½ (-0.01002–0.025748)=-0.0179 kJ/mol (4c)
The values of M1 and M2 can be expressed in wave numbers by the relation
1000cm-1=11.963 kJ/mol (5a)
By combining eqn (5a) with the relations (4b) and (4c), respectively, we get
M1=4.479 kJ/mol=374cm-1 (5b)
and
M2=-0.0179 kJ/mol=-1.50cm-1 (5c)
We thus can state that the critical vibration, necessary for reaction is at 374cm-1, much lower than the Eu vibration of M-N2 complexes at about 490cm-1 [6]. This difference will be discussed further on in this paper.
We also note that the coefficient of the second order term is small and negative, as expected for an anharmonicity term.
In the following, other systems will be tested as above
Ruthenium promoted by alkali metals
We now turn to another field, viz. that of supported metallic ruthenium, promoted by alkaline metals [10]. That investigation showed that ruthenium is more effective than iron under similar conditions but also that the types of support used is of tremendous importance. In the present paper we will follow the effect of support with the SET approach. The experimental data of interest in this connection are collected in Table 4. Calculations were performed at four different values of the common factor, CF = 3, 4, 5, 6 and the results for CF = 4 are presented in Table 4. In this table one arrives at a set of vibrational quantum numbers, n, that are thought to build up the activation energies. The difference between calculated and abbreviated values, abs (diff n), gives an indication of how good the estimation of these entities is.
In Table 5 we present the Root Mean Square for all choices of common factors. One notes from Figure 5 that RMS for CF = 4, most distinctly, shows the least value. Thus we prefer CF = 4 in future calculations in this chapter (Table 4,5).
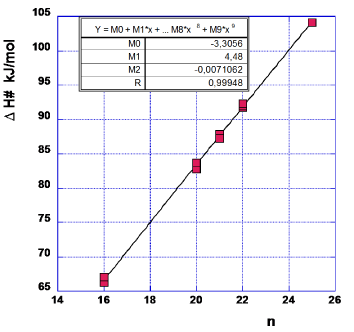
When plotting the activation enthalpies against the quantum number n (Figure 6) we use the CF=4 data from Table 4. We have however, deleted the data for the potassium-free experiments. From the ten sets of potassium-promoted catalysts we obtain (Figures 5,6).
M0=-3.31 kJ/mol (6a)
M1=4.48 kJ/mol=374cm-1 (6b)
M2=-0.0071 kJ/mol=-0.59cm-1 (6c)
The negative sign of the first term indicates the adsorption state of the reacting species, and the M2 term tells about the presence of anisotropy, although feeble. The M1 term gives a value of the ‘critical vibration’ similar to that in the previous chapter.
(Incidentally one can note that if a similar graph is constructed using all the thirteen data sets of Table 4, one gets a set of M values as M0 = -8.81, M1 = 5.07, M2 = -0.0218 and R = 0.9981. Thus, the absence or presence of potassium is of great importance).
Table 5 shows the dependence of RMS on the value chosen as ‘common factor’. The last row shows data calculated only on the ten sets where potassium promotion has been applied. The dip for CF = 4 is even more pronounced in this case than it is shown in Figure 5, where all thirteen experiments have been treated. Thus, also in this case LCF = 4.
Ruthenium promoted by alkaline earth metals and some other ruthenium catalysts
In this chapter we will investigate the influence of some alkaline earth oxides as support for ruthenium and for potassium promoted ruthenium reported by Aika and coworkers [11]. Also some other systems were studied and all data on the activation energies are given in Table 6. The procedure follows the scheme used in Tables 1,3. As before, ‘abs diff (4)’ stands for the absolutes of the differences between the calculated values of the expected vibrational quantum number and its abbreviated form, and ‘(4)’ indicates that it is formed for the case of CF = 4 (Table 6).
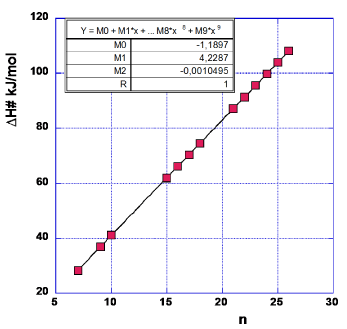
Alltogether four different cases for the common factor was investigated; CF = 3–6. The values of the root mean square of the difference between calculated and true quantum numbers are presented in Table 7. It is obvious from these data that CF = 4 gives a distinct minimum value of RMS, hence no graphics is needed in this case (Table 7, Figures 7,8).
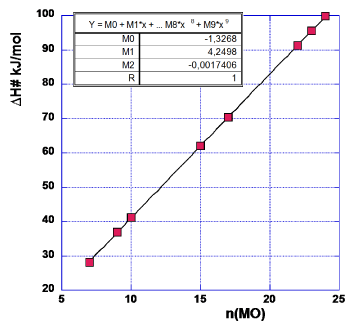
The differences between figure 7 (using all data of Table 6) and figure 8 (where only catalysts doped with alkaline earth metals were used) are not very pronounced. The negative sign of M0 indicates also in this case that the reacting species are adsorbed. We will, further on, focus our attention on the data from Figure 8:
M0=-1.33 kJ/mol (7a)
M1=4.2498 kJ/mol=355cm-1 (7b)
M2=-0.00174 kJ/mol=-0.1cm-1 (7c)
Discussion
Data obtained
In the previous chapters three different systems have been used to test the SET model. The data that emerges from the treatment (Figures 3,5,8) gives the following values for ν (the frequency of the critical vibration), viz. 374, 374 and 355cm-1. It is difficult to state if the internal differences are due to ‘experimental error’s or if they display a true difference between the properties of the systems. In the first case we might be allowed to form the mean value, of the three values obtained, as
ν=368±8cm-1. (8)
Such a frequency differs–as said above -from that found for coordination compounds [6]. However also the M–N2 stretching motion is expected to appear here. The coordination compounds, for which these assignments hold, differ from the metal adsorbed species in so far that the M moiety is much heavier for the latter ones so that one might expect vibrations of somewhat lower frequencies. Indeed, some measurements have been done on vibrational spectra of N2 adsorbed on metal surfaces [12,13]. De Paola et al., [12], apply EELS and can register an absorption band at about 300cm-1 for N2 adsorbed on pure ruthenium. They assign this to a M-N2 stretch vibration. Anton et al. [13], from a thorough investigation using high resolution EELS, report on the variation with coverage of the low frequency band that can be observed for N2 adsorbed on Ru(001): From the absence of an absorption peak related to the bending mode, they conclude that the nitrogen molecule is adsorbed perpendicular to the metal surface. (Compare Ref. [14] and ref. 1 and 2 in that paper).
We can now try to estimate the wavenumber of the bending vibration:
From studies on coordination compounds , e.g.[Os(NH3)5N2]2+ [6], we can find the difference between the wave numbers for the degenerate bending vibration (Eu) and the M-N2 stretch to be about 30±2cm-1 (for osmium complexes). Thus, for the systems discussed here, one arrives at
ν(E) ≈ 300+30 = 330±10cm-1 (9)
This value is not very far from that for the SET vibration as given above (8), viz.
ν=368±8cm-1
Neither of these just mentioned values are found in the vibrational spectra of solid metal–nitrogen interaction systems and hence we conclude, following Ref. [14], that. The N2 molecule is adsorbed in a perpendicular position relative to the metal surface. However, when comparing data from the coordination compound and from the adsorbate on the metal, one should remember that the metal of the coordination compound has an oxidation number of +2. Therefore the two systems are bound to differ somewhat.
If we now turn to the values of M2, i.e. the coefficient for the second order term, we find that it is negative in all cases, as is expected if it represents the anharmonic effect. Furthermore, the M2 coefficient is quite small: This, however, must be regarded as virtuous for a system that is supposed to successively build up its energy load from one and the same vibrator source, ω, by resonance. The smaller the difference between successive values of ν, i.e., the vibrator of the reactant and ω, the easier it must be to build up energy systems with quantum numbers up to 20 and more.
Let us then consider the M0 term that is supposed to indicate how strongly the reacting species is bonded to the metal. M0 is surprisingly small; indicating, in a way, a compromise between the necessity for the reacting molecule of being adsorbed (as discussed in the introduction) and the difficulty for the N2 group of being adsorbed at the temperatures concerned (cf. “Other suggested models of ammonia synthesis” (p-045).
One must note that the actual value and sign of M0 is very sensitive to the number of experimental points in the ∆H# vs n graphs and how close some of these points are to the origin. In the first example tested, iron intermetallics, this problem was discussed more fully.
The ω energy source
The basis of the SET model is that there exists a state of resonance between vibrations in the catalyst system and in the reacting molecule. The rate of the chemical reaction is put equal to the rate of energy transfer [1]. Such an approach makes it possible to calculate the so much doubted “isokinetic temperature” within (in some cases) 0.3% [15]. In the language of quantum theory, this rate is described by the number of vibrational quanta that are redistributed between catalyst and reacting molecule per time unit. Reaction occurs when a sufficient number of quanta have accumulated in the molecule, this collected energy corresponds to the activation energy (Appendix 1).
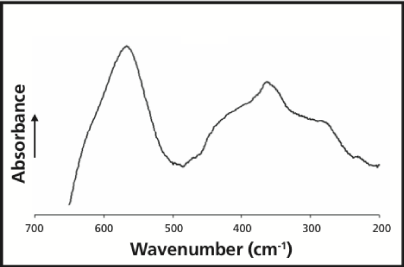
We can exemplify by considering the case of magnetite, the classical catalyst for ammonia synthesis [16]. In figure 9, from an investigation on synthetic magnetite [17], -we find a peak value at about 364cm-1, which agrees well with the mean value of the critical vibration found above (368cm-1). Thus one can conclude that (in the SET model) energy is donated from the magnetite catalyst to the adsorbed N2 molecule, favoring the addition of hydrogen atoms. This reasoning presumes that the magnetite is not just a precursor, but acts as a true catalyst.
Indeed an analysis has been made [18], of “the Mittasch catalyst” subjected to working conditions (T = 400 oC and p = 300 bar), indicating that not more than one half of the iron content is reduced to metallic iron. Our results above seem to indicate that the remaining iron oxide is actually Fe3O4. In such a case there will be an extremely short way from energy donating to energy accepting systems. This might be the reason for the long and successful industrial use of the Mittasch catalyst system.
If, on the other hand, it appears that all available iron is reduced [4], under working conditions, we find from figures 3–4, that the ‘free iron’ point falls equally well on the line that is defined by the Fe-intermetallics of the investigation [9].
However, returning to the IR spectra of metal–N2 coordination compounds [6], one notices that the bending vibration of the group M-N-N appears at about 530cm-1 (for Os) and–as pointed out above-the M-N stretch at somewhat lower values [6]. Therefore, it is comforting to note that in the case of magnetite we read an ω value that agrees well with the ν value deduced from the analysis of activation enthalpies. In chapter 3.1 we have tried to estimate the wave number of the M-N-N bending vibration–supposed to trigger the reaction-from spectroscopic data.
There is, however, other possibilities for the reacting molecule to gain energy by resonance, necessary for reaction. Somorjai and coworkers [19], have pointed out that in some cases only a small part of the reacting molecules is–loosely–adsorbed at the active sites of the catalyst, whereas the major part is strongly adsorbed, but not reacting. Somorjai has coined the name ‘spectators’ [20], for these strongly adsorbed species.
In the present context, we can really talk about ‘active spectators’, as it is very reasonable that the bending vibration of those species that are adsorbed at the active site (and where the hydrogen atoms are or can easily appear) and the bending vibrations of the ‘active spectators’, are not too different from one another. Therefore, e.g., ten spectators could emit one quantum each, and all these quanta are taken up by one reacting molecule at the active site. In this way an almost perfect resonance is operating.
Still another possibility for an energy donating system will be discussed in the next chapter.
Other suggested models of ammonia synthesis
The most commonly used description of the chemistry behind the Haber–Bosch reaction is the one favoured by Ertl and coworkers [4,21,22]. In their paper [21], they say “It is commonly believed that chemisorption of nitrogen is the slowest step in ammonia synthesis”.
Later on, Ertl and coworkers [22], further makes the statement that, (at working conditions), all nitrogen is adsorbed as atomic N* species. The building of NH3 follows from successive addition of H* species. Indeed, on these premises Ozaki et al. [23], constructed a rate equation incorporating the actual pressures of NH3 and H2. This equation–and other similar ones, that starts from the requirement that one nitrogen molecule covers two adsorption sites-has been widely used.
On the other hand, E. Ruch [24], put forward a theory based on the premise that the N2 molecule was adsorbed in the end-on mode–on symmetry arguments-and that these molecules were adsorbed perpendicular to the metal surface. It followed from Ruch’s reasoning that the adsorption took place on the Fe(111) plane.
Following this, Brill could show [25], that a rate equation built on Ruch’s findings was far better to describe experimental results than the relation based on a dissociative adsorption of N2 [23]. Furthermore, Schmidt [26], could show that N2H probably was the first species formed at ammonia synthesis.
Further work from the same group by field electron microscopy [27], showed that N2 was preferentially adsorbed at the (111) face of iron, and by infrared spectroscopy, that the N-N bond was not split at exposure of an iron catalyst with an N2+H2 mixture [28]. Rather, in the latter case, one could observe hydrazine-like spectra.
At about the same time Takezawa and Emmett [29], showed that nitrogen in molecular form could be adsorbed on the surface of an ammonia catalyst even at 600K and only 1 atm.
The above mentioned results–bearing evidence for an end-on structure-are supported by the absence of an infrared band corresponding to the N-N-M bending mode (p-044). Cf. Ref: [14].
Searching for resonance
It is now stimulating to try to create a conjunction between the two models of ammonia synthesis discussed here.
Ruthenium
The vibration of the atomic nitrogen adsorbed on a ruthenium surface has been studied by Dietrich, Jacobi and Ertl [30], with high-resolution electron energy-loss spectroscopy (HREELS). The result was that the ν(Ru-N) vibration shifted from 70.5 eV (569cm-1) to 75.5 eV (609cm-1) when the nitrogen load, [N*], increases from 0.25 to 0.38. Indeed, this variation was found to be temperature dependent so that, at temperatures responding to those used during industrial ammonia synthesis, the vibration frequency was asymptotically approaching 70.4 eV (568cm-1)
When looking for vibrational resonance, one must note that ω/ν must be expressed by small digits, but not necessarily 1:1.
We can thus form the ratio ω/ν for the two values of ν found from SET analysis; 374cm-1 and 355cm-1.
One obtains
ω/ν = 568/374 = 1.519 ≈ 3:2 (or 15:10 ) (10a)
and
ω/ν = 568/355 = 1.600 = 8:5 (or 16: 10 ) (10b)
This means that the resonance energy transfer can occur between two quanta of the catalyst system to three quanta of the reacting molecule, formula 10a. For the other case it seems slightly more difficult to activate the reacting molecule.
Iron
Now turning towards iron, chapter 2.1, there is presently only one set of data treated by SET. This treatment gives the ‘critical vibration’; ν = 374cm-1.
On the other hand two independent investigations both yield the same value of the Fe–N* vibration frequency, ω= 500cm-1 [31,32].
Erley and Ibach [31], used HREELS to study decomposition of ammonia adsorbed on Fe(110), whereas Okawa, Onishi and Tamaru used IR to study ammonia decomposition at evaporated iron films [32]. Thus we can form the ratio ω/ν:
ω/ν = 500/374 = 1.337 = 4 : 3 (or 12:9) (10c)
In this case we can state that three quanta of the catalyst system is interacting with four quanta of the reacting molecule. And further, it can be done with more confidence, as one of the investigations concerns a well-defined crystal surface [31], whereas the other one treats an evaporated and condensed iron layer [32]. We can then conclude that ω=500cm-1 probably also holds for the intermetallic systems that are treated in chapter 2.1.
Another example for comparison
In the case of HCOOH decomposition studied by Cremer [33] (and remaining a riddle for many years) the variation of the isokinetic temperatures was explained by considering quantum ratios like 5:4 and 4:3 [1,34].
Conjunction of theoretical models
The relations dicussed in 3.3.1 indicate a possible route for reaction, so that the atomically adsorbed nitrogen, affluent according to Ertl [22], as well as to Emmett [29] and with an M-N* stretching vibration of frequencies from 500 to about 570cm-1, carries energy to the bending vibration of the end-on adsorbed molecular N2 unit, existing at the pressures and temperatures applied, but in smaller amounts.
In order for the Ru-N unit to work as a catalyst system for the reaction of the Ru-N-N systems with hydrogen it is necessary that both Ru–N and Ru-N-N (or Fe-N and Fe-N-N systems in the iron case) are present simultaneously in reasonable quantities. As an example of what this can mean in the present study, we turn once more to the basic paper of Takezawa and Emmett [29]. These authors observed that there were two different types of adsorbed nitrogen: one that did not effect the adsorption of carbon monoxide, and one that hindered the CO adsorption. They concluded that the first one was atomic nitrogen, the other one represented the CO-like molecular, undissociated nitrogen.
Another system where the N2 adsorbed on the catalyst surface is hydrogenated before the N2 bond is split is found in the recent work by Hara, Hosono et al., [35], These authors used an ‘elctride’ as support, i.e. 12 CaO. 7 Al2O3: e-. It might be considered that the mobile electron of the support will loosen the strong N2 bond and thus decrease the bending vibration of the M-N-N unit and consequently also decrease the activation energy in the way described in the preseent paper.
The results of Takezawa and Emmett [29]
The data in Table 8 reflect the experimental conditions: When the surface had been subjected to an atmosphere of nitrogen (giving the total amount of nitrogen possible to adsorb for the given surface in the left column of Table 8), the atmosphere was changed to one of carbon monoxide. It is reported that a somewhat smaller amount of CO was adsorbed on the nitrogen covered surface than what was the case for CO adsorption on a completely pure surface (Table 8).
This was interpreted so that the part of adsorbed nitrogen that had been dissociated was adsorbed on sites where the adsorption of carbon monoxide was not hindered, whereas sites where molecular N2 was present were not attractive for CO bonding.
The difference between the amount of CO adsorbed for a completely pure surface and the nitrogen treated surface (∆CO) was taken to indicate the amount of molecularly adsorbed N2. From this result it is straightforward to obtain the amount of atomically adsorbed nitrogen (column 3 in Table 8).
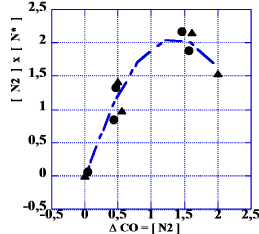
The lower part of the table indicates measurements where the pressure of CO is almost doubled. This increase of pressure was not of any great importance for the result as can be seen in Figure 10 where we have plotted the product [N2]×[N*] against [N2]. Such a product (last column in Table 8) is describing the ability of the system to react by catalysis as indicated above (Figure 10).
Now, from analyzing the function f(x) = x (A–x) one notes that it has a maximum at x = A/2 with a maximum value of A2 /4.
As the mean number of the total of adsorbed nitrogen (column 1 in Table 8) is 2.6ml, it is interesting to note that the maximum of the curve in Figure 10 appears at about 1.3ml.
Thus, the multiplication of [N2] and [N*] creates a coherent picture of the data, independent of pressure and temperature. This, of course, depends on the fact that [N2] is determined experimentally for each case.
Conclusions
The starting point of this work was to test the SET theory [1], on the hydrogenation of molecular nitrogen, As the N2 molecule is not infrared active, a suitable arrangement had to be found to make the vibrational energy of the catalyst system available for the reacting molecule. It was suggested that adsorption on a metal surface where an infrared active M-N-N bending might appear, corresponded to this demand.
Of course, the first part of this ‘arrangement’ is since long time fulfilled [16], as the Haber synthesis of ammonia rests on the use of solid-phase catalysts.
It turned out that the SET analysis of the activation energies of a series iron- or ruthenium-based catalysts gave a result for the critical vibration, designated as ν, for all the series investigated such as ν=368±8cm-1.
Such a value for an M-N-N bending vibration is in the neighbourhood of what is known from dinitrogen metal coordination compounds [6], so the first part of our SET test was deemed positive. When doing this comparison (368cm-1 vs about 500cm-1) one must remember that in the compounds concerned, [M(NH3)5 N2] X2, the metal has a formal oxidation number of +2, whereas the metal in the catalysts have a corresponding oxidation number of zero. Furthermore, the heavy load of “M” in the catalysts should also tend towards a lower value of the vibration in question for the catalysts.
But still remained a question: What is the nature of the resonating system, related to the catalyst itself, which should [1], transfer its energy via a resonance process to the ‘critical vibration’ of the reacting molecule?
One clear answer to this question was: the magnetite which is a vital part of the Mittasch catalysts [16], as long as not all of this oxide was reduced to iron metal. One might suggest operating conditions so that there were about equal amounts of metal and oxide [18]. Hence the fact that there exists a vibration of “free” magnetite with the top peak at about 364cm-1 confirms our hypothesis.
For all the other systems one must look for another resonance partner, ω. We have suggested two possibilities: The first is that a lot of nitrogen molecules are adsorbed in positions so that they cannot react themselves. Such molecules are denoted ‘spectators’ by Somorjai [20]. They might have M-N-N bending vibrations not very different from the reacting molecules. Thus a transfer of energy from ω to ν would be possible.
The other alternative that we suggest, relies on the well observed fact that in the ammonia synthesis environment there are lots of single nitrogen atoms adsorbed at the surface of the catalyst [4,21]. These atoms constitute an M-N* bond vibration with a frequency of the bond stretching representing ω. If it were so, one can–also here - see a conjunction of the conventional concepts of NH3 synthesis and the SET model.
We identify a large amount of N* and a small–but not negligible–amount of the adsorbed, undissociated molecule N2. Here the M-N* stretching vibration corresponds to the catalyst vibration ω.
This latter alternative would appear at the left- hand side of the curve in Figure 10, with a large amount of N* and a small–but not negligible–amount of the adsorbed, undissociated molecule N2. For the first reaction alternative, the opposite should hold: lots of molecular nitrogen, corresponding to the right-hand part of the curve of Figure 10. As this reaction model does not agree with experimental findings of a large surface concentration of N* [18], it seems less probable.
In Table 9, relevant data are collected for the different types of catalysts which are discussed and interpreted in this paper.
To finish, we must consider the unexpectedly low values of the adsorption enthalpy of the reacting molecules. It has been said above (chapter 3.1.) that this is a preferable situation for molecules that should react, but what does that really mean? The M0 term is of the order -2±1kJ/mol, indicating support of Somorjai’s thesis [19], that it is weakly bonded species that do react. The circumstance, that the same M1 coefficient is obtained for both Fe and Ru surfaces, indicates that such a weak bonding is strong enough to establish a proper straight M-N-N unit.
Information on a new catalyst
When this paper was close to its end, the present author was reached by news [36], on a new catalyst, Co3Mo3N, that was announced as a very good one for ammonia synthesis [37]. As the major part of the present paper was written a few years ago when the Co3Mo3N catalyst was not well known, I thank the anonymous reviewer most heartily for this help.
The information, thus gained, opens for a post scriptum: Most explanations, so far, of the new catalytic system seem to use a complicated scheme where the structure of the Co3Mo3N is given the main role, what results in complicated intermediates [36]. However, as the previous reasoning in the present paper strongly relates to the vibrational characteristics of the contacts between catalyst and reactant, one should like to look for the infrared spectrum of the presumed catalyst. Strangely enough, this appeared to be a difficult task.
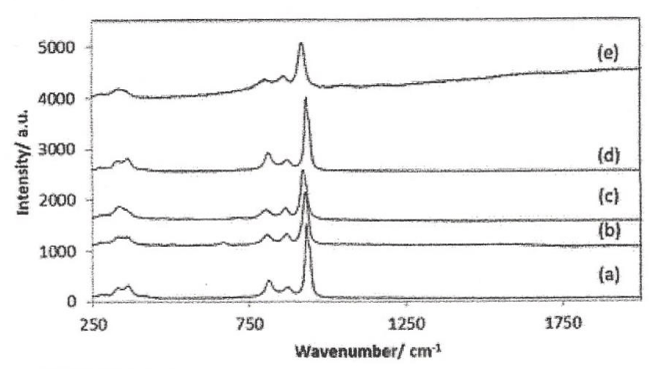
However, one of the many recent reports [38] contained information on the Raman spectrum of, inter alia, Co3Mo3N. That paper [38] reported a weak Raman “band” at 354cm-1 ( cf. Figure 11) Whether this is a mean value of a series of similar substances, or holds true for Co3Mo3N alone, cannot be told for sure, but probably it relates to the mean value. Furthermore, relying on the crude rule that a strong IR spectral band relates to a weak Raman band, and vice versa, we trust that the weak Raman band at 354cm-1 band actually represents a rather strong IR band.
One can now note, that this catalytically working vibration lies very close to those represented by eqn (8), viz., ν = 368±8cm-1, where, as stated above, ν represents the vibration that carries the reaction ahead. Thus, without any deliberation on the mechanism of the N2–catalyst interaction one can suppose that this interaction is most probably of the same kind as discussed in Chapter “Results” (p-040) (Figure 11).
One might further note that in the just mentioned Chapter it was found that there was a close agreement between ν = 368cm-1 given above and the frequency of the classical Mittasch catalyst (magnetite) at about 364cm-1 [17]. It is therefore interesting that one finds a similar nearness (between 354cm-1 and 368cm-1) in the present case. Indeed, one can observe that the value of 368±8cm-1 was obtained as the mean of two different sets of data of the same experiment [9], whereas one of the set of values (the one with all data points being taken into account, cf., eqn 4 b and Figures 3,4) was described by M1 = 4.2187kJ/mol or 353cm-1. This is obviously quite close to the value derived from the Raman spectrum of the Co3Mo3N preparation.
It is, however, not definitely sure, that the spectral data observed for Co3Mo3N are related to this latter substance as such. Rather, there are reasons to suspect that a surface coverage originating from desintegeration products give rise to some of them [38]. Figure 1 of Ref [38], or Figure 11 in the present paper, show a lot of Raman spectra of very similar appearance which are “consistent with the presence of a surface cobalt molybdate phase [39], as might be expected resulting from the presence of a surface passivaton layer [40], for the carbide and nitride materials, which are known to be air-sensitive” (Citation from Ref. 38.). This view is so much more reasonable as Co3Mo3N can be produced by ammonia treatment of CoMoO4 [38] and probably can disintegrate into, inter alia, MoO42- [38].
Because of these possibilities we have studied the paper of Frost et al., [41], on the mineral calcurmolite, with the formula Ca(UO2)3, 4(MoO4)3,(OH)2-5. 7 -12 H2O [42]. In this mineral, the vibrations of UO2 and MoO4 are distinctly different. The authors [41 mark, among other things, that two bands of the low frequency bands of the Raman spectrum are observed at 378 and 354cm-1, and state that these bands can be assigned to the ν2 bending modes of the MO4 unit [41,43,44]. It thus follows that there should be two bands in the low frequency Raman spectrum, something that is visible also in most of the spectra shown in Figure 11.
It is now very clear that the vibration frequencies of the catalyst systems under discussion agree very well with that for the “Mittasch” catalyst (Figure 9), viz., 364cm-1. There are two conditions that might motivate such an agreement;
Pro primo, the writing of the chemical formulae is more or less the same; Fe3O4 gives (Fe(II))2[Fe(III)O4] and CoMoO4 gives Co(II) [Mo(VI)O4].
Pro secondo, the mean of the two Raman frequencies, given here results in (378+354)/2 = 366cm-1 which is close to the IR data 368 ± 8 cm -1 given in eqn (8).
Whatever the cause of these coincidencies, we can most probably draw the conclusion that the N2–catalyst interaction for the Co3Mo3N case is similar–or the same–as described in the preceeding “Discussion”.
Finale
Thus SET, that is a new and probably strong tool to describe the catalytic processes, turns out to be useful even to describe the reaction of ammonia synthesis.
The almost identical values of the catalyst’s Raman data that has been found, makes us (following prof. G. Jeffery Leigh) regard the use of SET as a fruitful reconnaisance at the nitrogen front [45].
The author appreciates financial support from the University of Lund and from the Department of Chemical Engineering, University of Lund. Furthermore, valuable comments of an unknown referee are deeply appreciated.
Great thanks are also due to drs Payman Roonasi and Allan Holmgren at the Tecnical Unuversity of Luleå, Luleå, Sweden, for allowing me to reproduce the spectrum of Figure 9, as well as to Ms Paula Leckius at the printing office of the Chemical Center, Lund University, for increasing the visibility of the spectrum.
- Larsson R (2013) Concluding remarks on the theory of selective energy transfer and exemplification on a zeolite kinetics study. Monatsh Chem 144: 21-28. Link: http://bit.ly/2mYqnvl
- 2a) Kitte CWD, Knightt MA. Ruderman, Mechanics Berkeley Physics Course, Vol. 1, Chapt. 7, McGraw-Hill, New York, 1965.
- 2b) Larsson R (1989) A Model of Selective Energy Transfer at the Active Site of the Catalyst. J Mol Catal 55: 70-83. Link: http://bit.ly/2n66HWA
- Larsson R (1987) On the Stepwise Change of the Energy of Activation of Catalytic Reactions. Z Physik Chemie, Leipzig 268: 721-732. Link: https://tinyurl.com/y3e28253
- Ertl G (2008) Reactions at Surfaces. From Atoms to Complexity (Nobel Lecture) Angew Chem Int Ed Engl 47: 3524-3535. Link: https://tinyurl.com/y6582s5f
- Chatt J (1969) Nitrogen Complexes of the Platinum Metals; Pointers to a Mechanism of Fixation. Platinum Metals Rev 13: 9-14. Link: https://tinyurl.com/y59lloh4
- Bee MW, SFA Kettle, DB Powell (1974) Vibrational spectra of ruthenium and osmium pentammine carbonyls and nitrogenyls. Spectrochim Acta 30: 585-596. Link: https://tinyurl.com/y2jqfkmt
- Wang HP, Yates JT (1984) Infrared Spectroscopic Study of N2 Chemisorption on Rhodium Surfaces. J Phys Chem 88: 852-856. Link: https://tinyurl.com/yy6bo8ns
- Folkesson B (1973) ESCA Studies on the Charge Distribution in Some Dinitrogen Complexes of Rhenium, Iridium, Ruthenium and Osmium, Acta Chem Scand 27: 287-302. Link: https://tinyurl.com/y6gs59qb
- Aika K, Tamaru K (1995) Ammonia Synthesis over Non-Iron Catalysts and Related Phenomna, Chapter 3, Ammonia Catalysis and Manufacture, A Nielsen (Ed), Springer Verlag, Berlin Heidelberg. Link: https://tinyurl.com/y6axmsfk
- Aika K, Hori H, Ozaki A (1972) Activation of Nitrogen by Alkali Metal Promoted Transition Metal, I. Ammonia Synthesis over Ruthenium Promoted by Alkali Metal. J Catal 27: 424-431. Link: https://tinyurl.com/y64nnazh
- Aika K, Ohya A, Ozaki A, Inoue Y, Yasumori I (1985) Support and Promoter Effect of Ruthenium Catalyst; II. Ruthenium/Akaline Earth Catalyst for Activation of Dinitrogen. J Catal 92: 305-311. Link: https://tinyurl.com/y5xk3z5z
- de Paola RA, Hoffmann FM, Heskett D, Plummer EW (1987) Adsorption of molecular nitrogen on clean and modified Ru(001) surfaces: The role of s bonding. Physical Review B 35: 4236–4249. Link: https://tinyurl.com/yyfh6us4
- Anton AB, Avery NR, Toby BH, Weinberg WH (1983) The Chemisorption of Nitrogen on the (001) Surface of Ruthenium. J Electron Spectrosc Relat Phenom 29: 181-186. Link: https://tinyurl.com/yxrr5q97
- Greenler RG, Snider DR, Witt D, Sorbello RS (1982) The Metal-Surface Selection Rule for Infrared Spectra of Molecules Adsorbed on Small Metal Particles. Surf Sci 118: 415-428. Link: https://tinyurl.com/y25cak5f
- Keane MA, Larsson R (2007) Isokinetic behaviour in gas phase catalytic hydrodechlorination of chlorobenzene over supported nickel. J Mol Catal 268: 87-94. Link: https://tinyurl.com/yy9efubl
- Mittasch A (1950) Early Studies of Multicomponent Catalysts. Adv Catal 2: 81-104.
- Roonasi P, Holmgren A (2009) A study on the mechanism of magnetite formation based on iron isotope fractionation. Proc. EPD Congress sponsored by the Extraction and Processing Division (EPD) of the Minerals, Metals & Materials Society (TMS); Howard,S.M. (Ed.); Warrendale, Pa. Minerals Metals Mater Soc 829-836. Link: https://tinyurl.com/yxj3jxsx
- Ertl G, Prigge D, Schlögl R, Weiss M (1983) Surface Characterization of Ammonia Synthesis Catalysts. J Catal 79: 359-377. Link: https://tinyurl.com/yy8ncqt2
- Cremer PS, Su X, Shen YR, Somorjai GA (1996) The first measurement of an absolute surface concentration of reacting intermediates in ethylene hydrogenation. Catal Lett 40: 143-145. Link: https://tinyurl.com/y5w8w9fx
- Cremer PS, Su X, Shen YR, Somorjai GA (1996) Ethylene Hydrogenation on Pt(111) Monitored in Situ at High Pressure Using Sum Frequency Generation. J Am Chem Soc 118: 2942-2949. Link: https://tinyurl.com/y2rfvwz8
- Bozso F, Ertl G, Grunze M, Weiss M (1977) Interaction of Nitrogen with Iron Surfaces. I. Fe(100) and Fe(111). J Catal 49: 18-41. Link: https://tinyurl.com/y6ouuas5
- Rosowski F, Hornung A, Hinrichsen O, Herein D, Muhler M et al. (1997) Ruthenium catalysts for ammonia synthesis at high pressures: Preparation, characterization, and power-law kinetics. Appl Catal A 151: 443-460. Link: https://tinyurl.com/y3g78pnj
- Aika K, Ozaki A (1969) Kinetics and Isotope Efects of Ammonia Synthesis over an Unpromoted Iron Catalyst. J Catal 13: 232-237. Link: https://tinyurl.com/yxh2g4bj
- Ruch E (1960) Zur Theorie der koordinativen Verbindungen. 10 Jahre Fonds der Chemischen Industrie, Düsseldorf 163-173.
- Brill R (1970) Another Rate Equation for the Catalytic Synthesis of Ammonia. J Catal 16: 16-19. Link: https://tinyurl.com/y28xrb5g
- Schmidt WA (1968) Mass-spectroscopic Study of the Synthesis of NH3 on Iron Tips. Angew. Chem., Intern. Ed 7: 139-139. Link: https://tinyurl.com/y2jdk2yc
- Brill R, Richter EL, Ruch E (1967) Adsorption of Nitrogen on Iron. Angew Chem Intern Ed 6: 882-883.
- Brill R, Jiru P, Schultz G (1969) Infrarotspektren von N2 – H2- Adsorptionskomplexen an einem Eisenkatalysator. Z Physik Chem NF 64: 215-224. Link: https://tinyurl.com/y4g2empz
- Takezawa N, Emmett PH (1968) Interaction of Nitrogen and Carbon Monoxide on Iron. Synthetic Ammonia Catalysts. J Catal 11: 131-134. Link: https://tinyurl.com/y2gae58e
- Dietrich H, Jacobi K, Ertl G (1996) Coverage, lateral order, and vibrations of atomic nitrogen on Ru (0001). J Chem Phys 105: 8944-8950. Link: https://tinyurl.com/yy52kwsd
- Erley W, Ibach H (1982) Vibrational spectra of ammonia adsorbed on Fe(110). Surface Sci 119: L357-L362. Link: https://tinyurl.com/y24ulecz
- Okawa T, Onishi T, Tamaru K (1977) Infrared study of chemisorbed ammonia on an evaporated Iron Film. Chm Lett 1077-1078. Link: https://tinyurl.com/y3xdwdv9
- Cremer E (1955) The Compensation Effect in Heterogeneous Catalysis. Adv Catal 7: 75-91. Link: https://tinyurl.com/yyrer4yr
- Larsson R (1996) Catalysis as a resonance effect. V. Factors that determine the isokinetic temperature in catalytic reactions. React Kinet Catal Lett 8: 115-124. Link: https://tinyurl.com/y6nbcymq
- Kitano M, Kanbara S, Inoue Y, Kuganathan N, Sushko P, et al. (2015) Electride support boosts nitrogen dissociation over ruthenium catalyst and shifts the bottle neck on ammonia synthesis. Nature Communications 6. Link: https://tinyurl.com/y27yrevj
- Zeinalipour-Yadzi CD, Hargreaves JSJ, Catlow CR (2016) DFT-D3 Study of MolecularN2 and H2 Activation on Co3Mo3N surfaces. J Phys Chem 120: 21390-21398. Link: https://tinyurl.com/y5umovc9
- Zeinalipour-Yadzi CD, Hargreaves JSJ, Catlow CR (2018) Low-T Mechanisms of Ammonia Synthesis on Co3Mo3N. J Phys Chem 122: 6078-6082. Link: https://tinyurl.com/yy2emvn8
- Alshibane I, Laassiri S, Rico JL (2018) Methane Cracking over Cobalt Molybdenum Carbides. Catal Lett 148: 1643-1650. Link: https://tinyurl.com/y4cvqogk
- Xu K, Chao J, Li W, Liu Q, Wang Z, et al. (2014) CoMoO4·0.9H2O nanorods grown on reduced graphene oxide as advanced electrochemical pseudocapacitor materials. RSC Adv 4: 34307-34314. Link: https://tinyurl.com/y4a2hq73
- Alconchel S, Sapina F, Martinez E (2004) Daöton Trans 16: 2463.
- Frost RL, Cejka MJ, Dickfos MJ (2008) Raman and infrared spectroscopic study of the molybdate conaining uranyl mineral calcurmolite. J Raman Spectroscopy 39: 779-785. Link: https://tinyurl.com/y2gzsnom
- AlShibane I, Hargreaves JSJ, HectorAL, Levason W, McFarlane A (2017) Dalto Trans 46: 8782.
- Brown RG, Denning J, Hallett A, Ross SD (1970) Spectrochimica Acta, Part A: Molecular and Biomolecular Spectroscopy; .Selection Rules for Molecular and Lattice Vibrations and the Correlation Method 26: 963.
- Farmer VC (1974) The Infraed Spectra of Minerals; Mineralogical Society Monograph 4; The Mineralogical Society, London, UK. Link: https://tinyurl.com/y33888ng
- Leigh J (2001) All quiet on the N front, Chem. Br 37: 23-24.
Article Alerts
Subscribe to our articles alerts and stay tuned.
 This work is licensed under a Creative Commons Attribution 4.0 International License.

 Save to Mendeley
