Annals of Mathematics and Physics
Paintings crack initiation time caused by microclimate
Mohammad Yaghoub Abdollahzadeh Jamalabadi*
Cite this as
Abdollahzadeh Jamalabadi MY (2021) Paintings crack initiation time caused by microclimate. Ann Math Phys 4(1): 092-101. DOI: 10.17352/amp.000028Copyright
© 2021 Abdollahzadeh Jamalabadi MY. This is an open-access article distributed under the terms of the Creative Commons Attribution License, which permits unrestricted use, distribution, and reproduction in any medium, provided the original author and source are credited.The current paper aims to use an irreversible cohesive zone model to investigate the effects of temperature and relative humidity cycles on multilayer thin-film paintings. The homogenous one-dimensional paint layers composed of alkyd and acrylic gesso over a canvas foundation (support) with known constant thicknesses are considered as the mechanical model of painting. Experimental data was used for mathematical modeling of canvas as a linear elastic material and paint as a viscoelastic material with the Prony series. Growth of crack through the length of the paint layers under the low amplitude cyclic stresses are modeled by cyclic mechanical loadings. The three-dimensional system is modeled using a finite element method. Fatigue damage parameters such as crack initiation time and maximum loads are calculated by an irreversible cohesive zone model used to control the interface separation. In addition, the effects of initial crack length and layers thickness are studied. With the increase of the painting thickness and/or the initial crack length, the value of the maximum force increases. Moreover, by increasing the Relative Humidity (RH) and the temperature difference at loading by one cycle per day, the values of initiation time of delamination decrease. It is shown that the thickness of painting layers is the most important parameter in crack initiation times and crack growth rate in historical paintings in museums and conservation settings.
Nomenclature
A: Arm cross-sectional area; A0: Sample’s original cross-sectional area; a: Length of the crack; b: Arm width; C: Experimental constant for Paris’ Law equation; D: Damage parameter; E: Young’s elastic modulus; f: Stress function; G: Energy release rate; Gc: Adhesive fracture energy of a peel arm; Gp: Local plastic/viscoelastic work done per unit area; g: Prony series parameter; ge: Prony series equilibrium parameter; h: Peel arm thickness; hc: Width of the fracture front; I: First stretch invariant; K: Stress intensity factor; L: Element characteristic length; L0: Sample’s original length; m: Experimental constant for Paris’ Law equation; M: Number of terms; P: load; T: Temperature; tn: time; W: Strain energy; α: Parameter in van der Waals time independent material parameters; βeff: Hygrothermal coefficient; δ: Crack displacement, separation; εx,y,z: Principal strains; σ x,y,z: Principal stress; ν: Poisson’s ratio
Introduction
A painting structure consists of support (wood panel and canvas), glue sizing, ground, and paint film (binding media and pigments). Different mechanical properties of the various layers (support, ground, and paint) through aging can lead to craquelure in paintings. environmental changes such as humidity caused stress in the different paint layers which sometimes leads to strains of more than 1% (restrained layers) and produces a stress rise in the painting or shrinkage of the glue size during desiccation. Accumulation of such failures in cyclic load result in fatigue, plastic deformation (ductile failure), and fracture (brittle failure), and fracture.
The interface between various materials, for example, the interface between a solid gravity dam and the bedrock, is constantly a powerless connection, advancing split commencement and prompting break even under administration loads [1]. The irreversible cohesive zone model is an appropriate system to investigate and assess the potential crack at a bi-material interface [2]. In light of the irreversible cohesive zone model, some interfacial crack parameters, for example, break vitality and break durability were explored through exploratory and numerical studies [3,4]. The exploratory examinations showed that the greatness of interfacial unpleasantness would affect the previously mentioned interfacial crack parameters, driving analysts to contemplate its impact by researching examples with smooth interfaces and fake scoring interfaces [5]. The problem of stress analysis of a plate having an elliptical hole is the first case in this field. For the first time, Griffith [1] (based on thermodynamics , proposed the energy-balance concept of fracture . Figure 1 presents the schematic of the 2D plane stress problem of a plate having an elliptical hole.
Historical paintings in museums are one of the materials that suffer various low-stress cycles which can cause the initiation of a crack or accelerate the crack growth rate [6]. For semi-weak materials, the fracture procedure zone lies before the split-tip and pulls in huge concerns when considering the nonlinear reaction of a designing structure built with semi-fragile materials during the crack procedure [7]. The impact of the fracture procedure zone on the crack parameters of cement, as a sort of semi-fragile material, has been widely examined over the most recent couple of decades [8-10]. The size impact of the particular break vitality was observed to be connected with the fracture procedure zone properties [11,12], showing that the fracture procedure zone length specifically diminishes quickly when the split engenders near the top surface of an example [13]. Thusly, the neighborhood break vitality was observed to be not consistent during the entire crack procedure and rather diminished with the decrease of the fracture procedure zone length [14]. Consolidating the hypothetical and exploratory investigations, a bilinear model on neighborhood crack vitality conveyance was proposed to ascertain the genuine explicit break energy [15].
Numerous non-linear models have been established to characterize the fatigue parameters such as size, shape, material , and, test method. J-integral is used by many methods. The cohesive crack model used fracture energy , strength in uni-axial, and elasticity module. As well, the crack band model also uses a width of micro-cracks. The huge impact of a changing fracture procedure zone on solid break attributes and the whole crack procedure has drawn in logical and building networks. Significant examinations have been brought out through test investigations [16-18] and numerical simulations [17-21]. Be that as it may, the examination of the development of the fracture procedure zone during the total crack procedure at a stone solid interface has been minimally detailed. As to shaking concrete interfacial crack, it is beneficial to bring up that the determined break vitality dependent on crack length without considering the fracture procedure zone is not as much as that dependent on nonlinear crack mechanics [22] by 83%. Along these lines, it is huge to join the investigation of the fracture procedure zone advancement at the stone solid interface when investigating the crack system and evaluating the nonlinear reaction of a solid structure developed on bedrock [23,24]. In the interim, the split engendering criteria in numerical strategies have been generally examined, which show the component of break development in semi-weak materials like cement. Determination of the fracture energy of mortar and concrete using three-point bend tests on notched beams by numerous specialists [25-27].
Artists’ paintings are composed of polymeric layers. One of the main problems in polymeric coating materials is to endure mechanical fractures over a continued loading. Painting on canvas made the use of a binder for the pigmented paint layers [28]. The pigment material provides the color, the binding medium a substance that ensures that the colored material remains in the applied place. Common paint binders are Steam-pressed linseed oil, Acrylic Resins, and Alkyd resins. The impacts of temperature and changes in the vapor content of air on the mechanical properties of the painting layers in artwork have been examined in many works [29]. In painting which is made of various layers, delamination growth is likely to occur under mixed-mode loading. Delamination between an alkyd configuration layer and acrylic prepared canvas because of cyclic changes in RH has recently been explored [30]. Common environmental control specifications for galleries and museums are relative humidity at 50 or 55 ± 5% relative humidity (RH) and temperature in winter at 19 ± 1°C and summer at 24 ± 1°C [31]. The work executes the irreversible firm zone model in a limited component examination to display the interface between alkyd paint and prepared the canvas, which results in an alteration to the footing detachment law to represent exhaustion harm. Mecklenburg [32] demonstrated that the constituents show diverse dimensional and stress-strain reactions relying upon the ecological conditions. A straightforward order of splits in easel works of art was first efficiently connected by Keck [33]. Recently, the type of separation in the interfacial interaction of modern paint layers has been distinguished by Young [34]. Diverting and interfacial splits have likewise been distinguished, and poor bond characteristics are featured when blended-media paints are utilized on canvas for example in a blend of acrylic and alkyd paint layers. Inverse analysis can be employed to optimize the coating design [35-40]. The effect of breaking glass is also following a crack propagation, especially on the nano-scale. The authors should mention this, and two studies, which showed this by the example of atomic force microscopy [41,42] and neutron scattering (in form of Yoneda Wings) [43,44].
In the present study, a two-layer painting is simulated in 3D stress conditions with the finite element method. This simulation has been carried out in steady-state, isothermal, and single-phase, and the effect of temperature variations, layer thickness, and initial crack length on the crack initiation time and the maximum load of the painting are investigated. Also, the distribution of the stress in the painting regions has been studied and evaluated.
Model details and validation
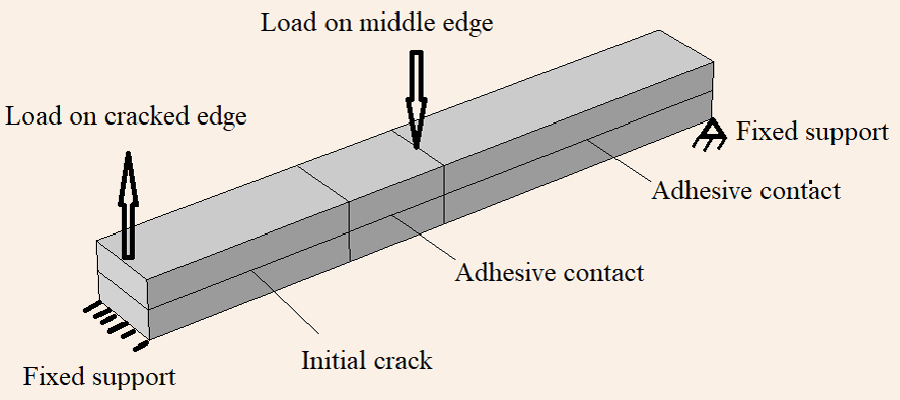
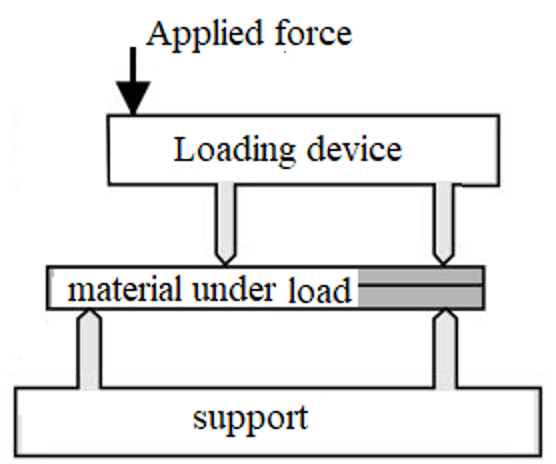
In this study, a single support canvas with a paint layer is modeled in three dimensions. The schematic of the paint, the canvas layer, and the interface is illustrated in Figure 2. Forces are applied to the top edges at the cracked end and the center of the test specimen. In this figure, the upper part of the geometry is the painting and the lower part is the canvas. In this figure, the crack of composite structures develops as delamination between plies. As the geometry of the problem is shown in Figure 2, the layers cracked along a ply interface, and the test specimen is supported at the outermost bottom edges. Because of the symmetry, just half of the test specimen is considered and a symmetry boundary condition is applied. The experimental setup of loading is plotted in Figure 3. Table 1 shows the geometry parameters of the experimental setup in [27].
The main parameters in FEA modeling of the current system are stress and strain . The properties of unidirectional laminates composite AS4/PEEK (APC2) which is a carbon fiber reinforced composite used for experimental setup [27]. Correspondingly, the geometric, material properties of the laminate composite were extracted from Camanho et al. [27]. The orthotropic linear elastic properties assume that the longitudinal direction is alongside the global longitudinal direction. The experimental tests are performed in [27]. In numerical modeling, the de-cohesion elements are divided into two groups point and continuous de-cohesion elements. Here to calculate delamination onset and growth surface elements used for de-cohesion elements. The initial crack length is cl. Traction (obey bilinear traction-separation law) linearly increases (with a stiffness Kp ) in anticipation of the ultimate displacement (u0) where the opening crack reaches a failure initiation. After that the stiffness reductions by an increase of the damage (material softens irreversibly) till the failure at zero stiffness (uf). In mode I separation displacement is normal to an interface while on mode II and III separation displacement is tangential. The values of initial and final displacement are certain of the mode of failure.
The crack stress modes are:
• I opening mode: surfaces displacements perpendicular to the crack plane.
• II sliding mode: surfaces displacements perpendicular in the crack plane.
• III tearing mode: surfaces displacements perpendicular in the crack plane and parallel to the leading edge of the crack.
For the current study the mixed-mode mode I, mode II mode, and III separation displacement are included then a combination of separation displacement is used as modeled by Kenane and Benzeggagh [38].
As shown material resistance to crack extension firstly is a linear and continuous balance between consumed energy and released energy is maintained during slow stable crack growth. Because of slow stable crack extension, finally, the rising shape is observed (it is flat for truly brittle material).
Governing equations
The triaxle stress-strain formula for homogeneous materials is as follows.
(1)
(2)
where andare the principal strains , and are the principal stresses, is the fracture strain by the opening of the micro cracks, E is Young’s elastic modulus, v is its Poisson’s ratio, hc is the width of the fracture front, is the crack displacement, is the strain at the end of strain-softening at which the micro-cracks coalesce into a continuous crack, Poisson ratio of νs , Young’s modulus of E and vanishes.
In continuum mechanics, other than the most commonly used measure of stress is the Cauchy stress tensor (true stress) several alternative measures of stress can be used as The Kirchhoff stress, The Nominal stress, The first Piola–Kirchhoff stress (transpose of the nominal stress), The second Piola–Kirchhoff stress (PK2 stress), Mandel stress tensor, Rotation tensor, and The Biot stress.
The stress tensor is defined by
(3)
while stress is associated with the Cauchy stress tensor by
(4)
The displacement dynamics is
(5)
where a Rayleigh damping factor proportional to the stiffness is used for the beam and J is the determinant of F and the deformation gradient tensor is computed from
(6)
and for the St. Venant-Kirchhoff material, the Lagrange strain tensor E is calculated by
(7)
The initial condition of the system is the stationary condition.
Ogden and van der Waals models are usually used in literature for uniaxial tension. Hagan, et al. [29] announced that the mechanical reaction of latex paints under uniaxial stacking can be depicted utilizing the hyperplastic, van der Waals model, related to the time-needy, viscoelastic Prony arrangement. They used pigments and coloring material of titanium white acrylic gesso and phthalo blue alkyd. By the use of the viscoelastic model, one can model the creep at constant stress [37], relaxation at a constant displacement, recovery without the stress, constant rate stress, and constant rate strain.
The time-dependent manner of the viscoelastic material is given by the Prony series as (see Table 3 for the constant of Prony Series):
(8)
where and the stress as a function of is:
(9)
The strain vitality capability of the van der Waals model [31] is given by:
(10)
where α is the chain interaction parameter (0.5), λm is the locking stretch (for Alkyd is 8 and for Gesso is 10), μ is the shear modulus (for Alkydis 75 MPa and Gesso is 125 MPa) and I is the first stretch invariant:
(11)
Table 4 shows the material properties of the cohesive zone model interface. Based on the analytical method vertical separation of the cantilever tip and the energy release rates for modes I and II are
(12)
(13)
(14)
Where P denotes the loading force; E is Young’s modulus; a is the crack length; B is the width of the beam; h is the thickness of beam; I is the second moment of area of the cantilever beam ; x is the correction parameter ; G is the shear modulus. Cyclic loading can be described using the stress amplitude, mean stress, and stress range, respectively. Based on Paris law the fatigue crack growth rate is defined
(15)
The cohesive zone model assumes a linear relationship between cohesive stress responses
(16)
and damage parameter is defined
, for δ > δinitial (17)
and
D=0 for δ ⩽ δinitial (18)
which the stiffness is changed with cyclic loading to (1-Dc) times. The onset of delamination growth is defined as:
(19)
where the energy release rate at maximum loading is larger than the Gthreshold or one percent of critical energy release rate which is 0.8. As well as the propagation of the delamination is defined by the rate of damage is defined as:
(20)
Results and discussion
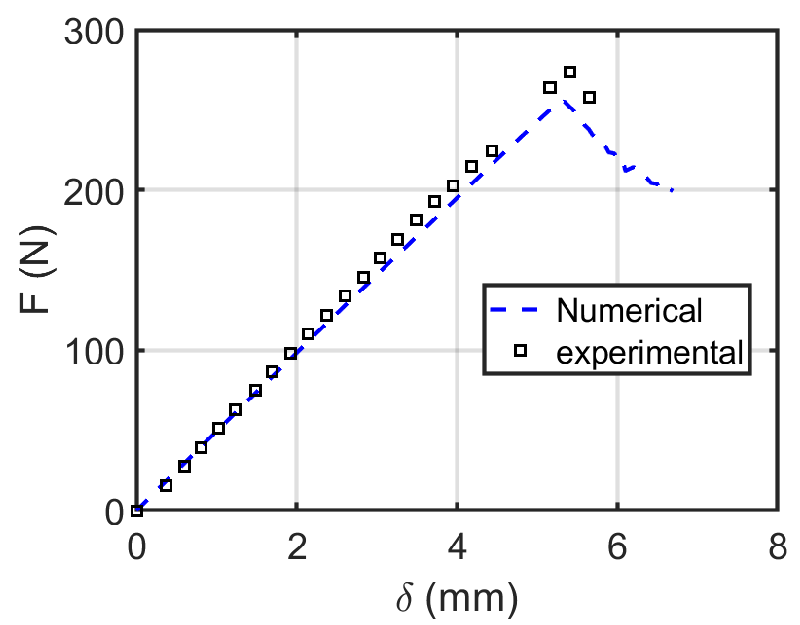
The model in Part 2 is as as simple to model the peeling effect of environmental forces on painting. Since it can support the analysis later in this article. The correctness and reliability of the subsequent method are investigated in this part. Simple forces and constraints are applied to the model, which can conform to the engineering situation.
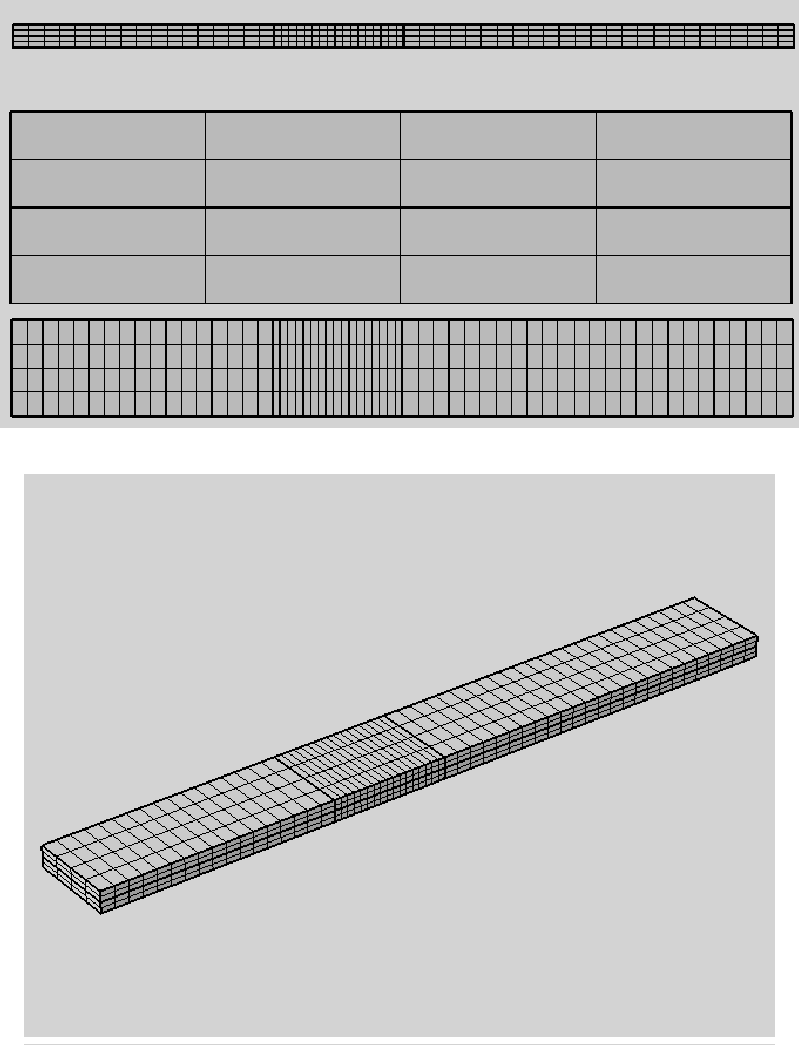
A finite element method-based (FEM) code is used for numerically solving differential equations arising in the current simulation in three space variables. The FEM subdivides a large system into smaller, simpler parts that are called finite elements. This is achieved by a particular space discretization in the space dimensions, which is implemented by the construction of a mesh of the object: the numerical domain for the solution, which has a finite number of points (see figure 4). The finite element method formulation of a boundary value problem finally results in a system of algebraic equations. The FEM then approximates a solution by minimizing an associated error function via the calculus of variations. A FEM method is applied through the following criteria on the rate of strain.
(21)
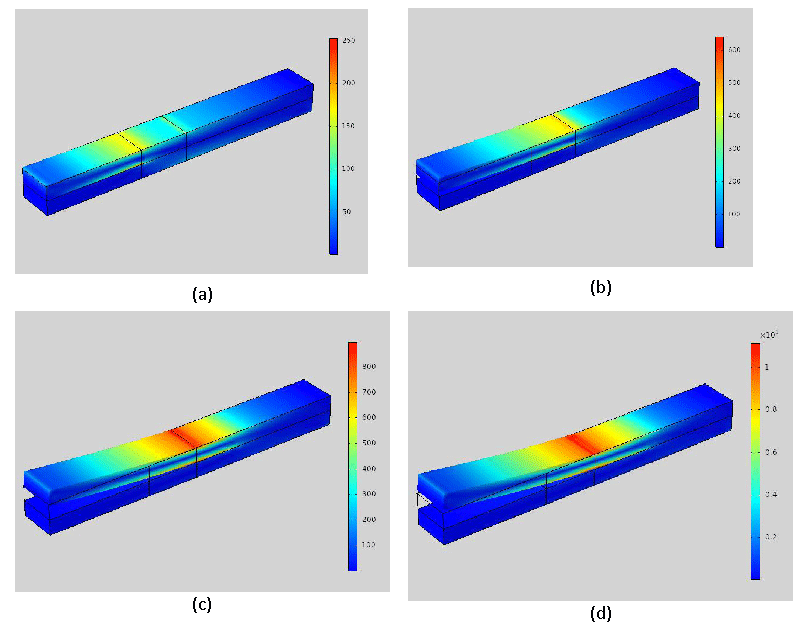
Fatigue failures in painting take place in the interface of the painting and canvas layer [32]. Here a similar geometry of the experimental setup is used (see Figure 1). In Figure 6, the stress variation in the materials is displayed. Stress contours for various displacements (0.4, 1.8, 4.5, 6 mm) are illustrated in Figure 6. The stress contour with the unit of Pa (N/m2) has the highest values at the crack edge and under the loading place in the middle. The maximum stress across the layer is 250 Pa at the lowest displacement and throughout the highest displacement is more than kPa. Although the stress has increased in both layers, the pressure drop in the painting is larger than the canvas. Since the stress in the painting layer is 2.5 times the stress in the canvas layer.
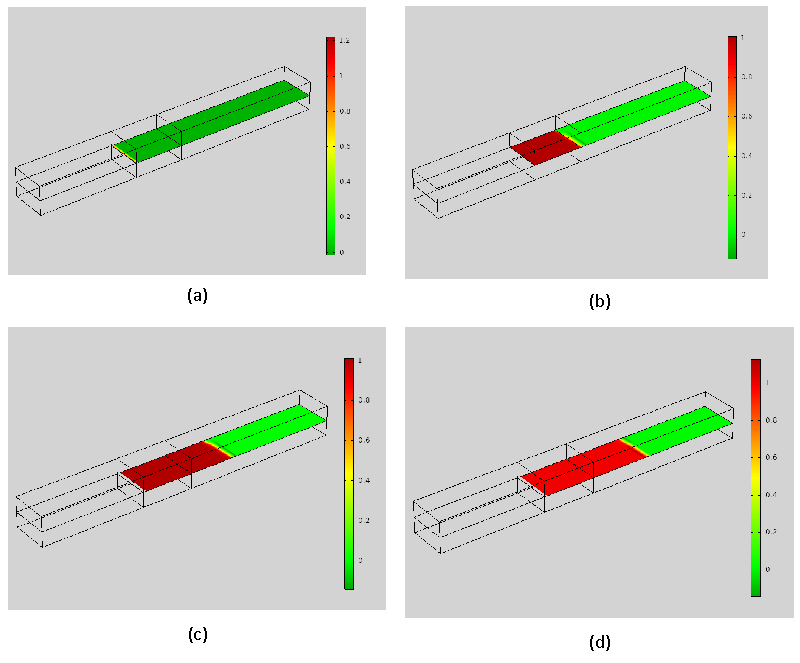
The damage parameter defined here (see equation (17)) doesn’t include the micro-damage accumulation, cracking, and deterioration on the micro-level (which is subjected to the influence of stochastic factors) and clearly show the macroscopic fatigue crack propagation up to the final failure. In Figure 7, the damage evolution in the materials is displayed. Damage contours for various displacements (0.4, 1.8, 4.5, 6 mm) are illustrated in Figure 7. The maximum damage across the layer is 1. Although the damage region has enlarged versus displacement, the depth is not changed linearly. At a displacement of 0.4 mm, damage initiated while at 4.5 mm reaches the mid-plane and at 6 mm reached the final displacement.
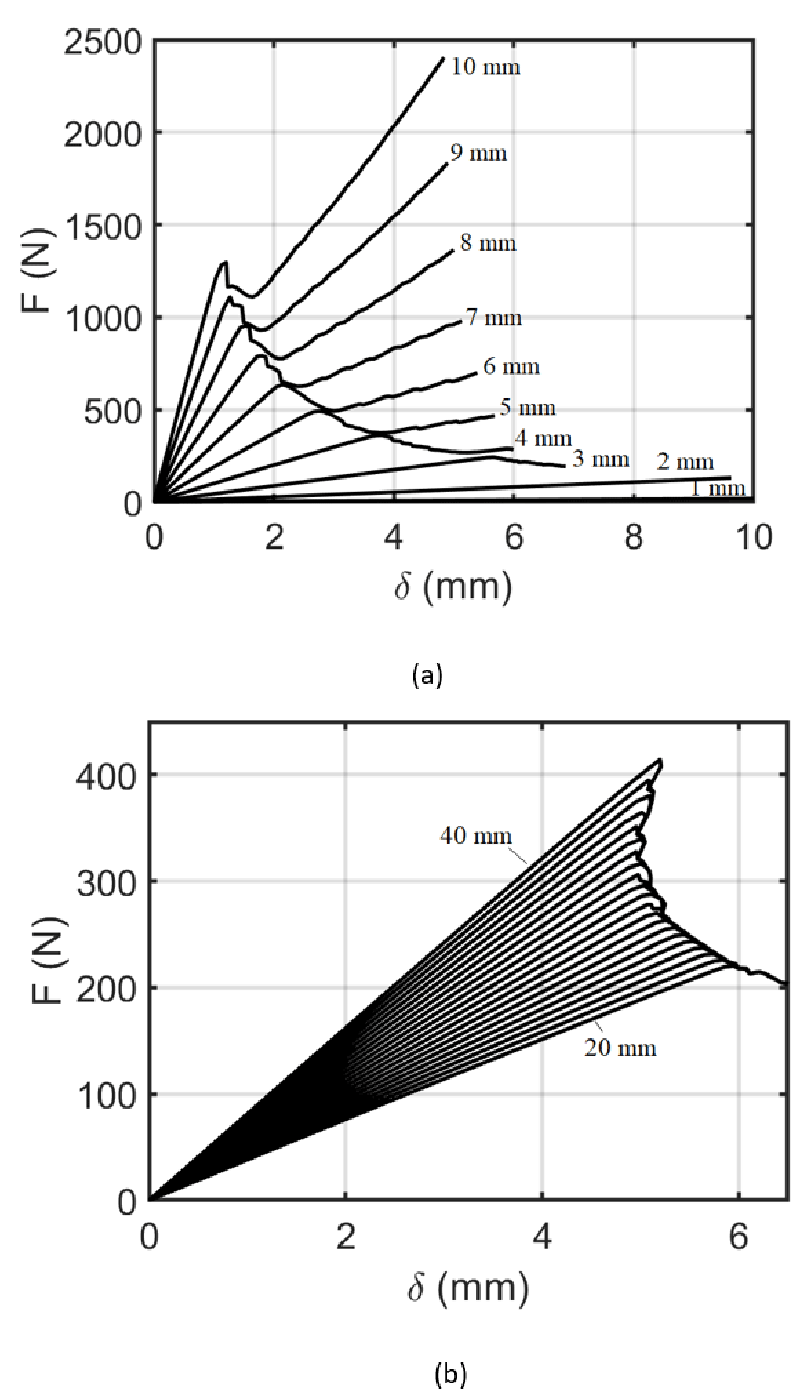
The effect of painting layer thickness and initial crack length is revealed in Figure 8. In Figure 8 a, the painting layer thickness is shown at 20°C. Regarding the figure, it can be seen that the behavior of forced displacement is similar while the values are different. In contrast to low thickness cases, the increasing behavior of curves is observed after the initial displacement and the highest at the final displacement. In Figure 8 a, the thickness of the painting system is changed from 1 mm to 1 cm. By increasing of painting system’s thickness, the value of maximum force increases. In Figure 8 b, the painting layer thickness is shown at 20°C. Regarding the figure, it can be seen that the behavior of forced displacement is similar while the values are different. In all cases, the decreasing behavior of curves is observed after the initial displacement and the highest at the initial damage displacement. In Figure 8 b, the initial crack length of the painting system is changed from 2 cm to 4 cm. By increasing of painting system’s initial crack length, the value of maximum force increases.
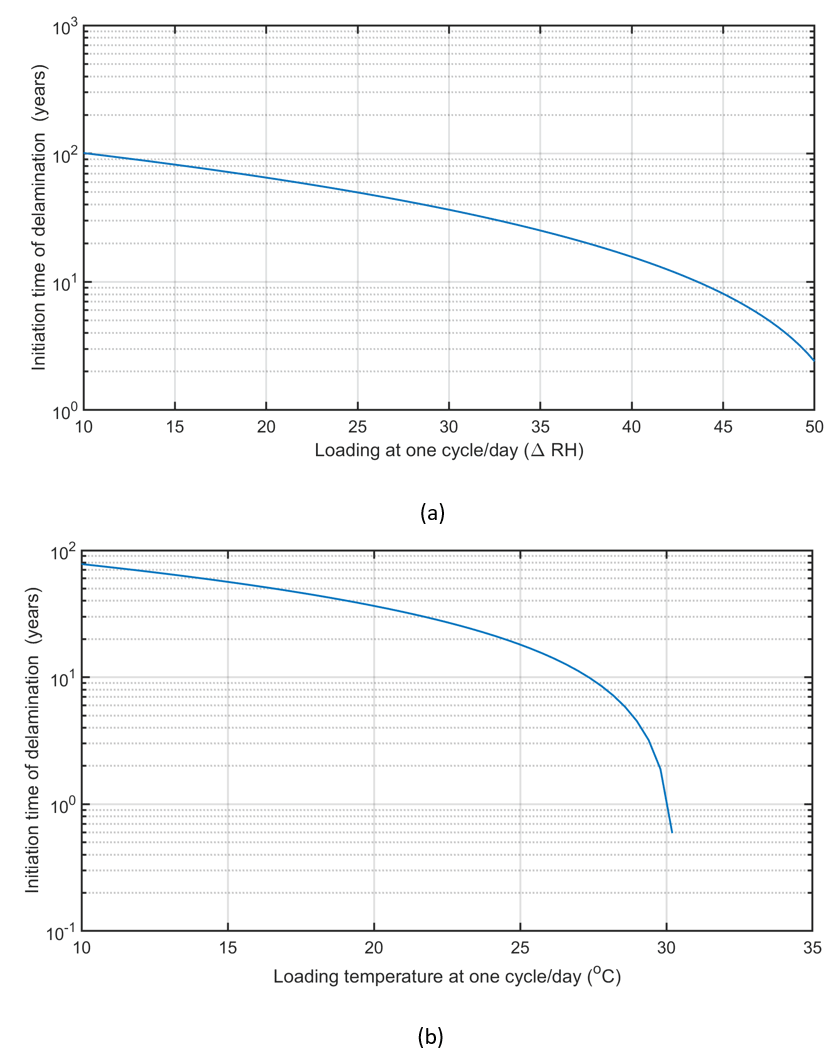
Figure 9 reveals the initiation time of delamination versus loading relative humidity percent at one cycle/day and loading temperature. For polymer coatings used in disposable products or households, the designated polymer would only be anticipated to last a few years, for cars and buildings around ten years. When the RH cycles have been resolved for the works of art, it is conceivable to actualize them as limit conditions. It has been recognized that on a quiet day the RH cycle is roughly sinusoidal and has a most extreme RH of 95%RH at 06:00 in the first part of the day (min temp) and the base of 35%RH at 15:00 toward the evening (max temp). In this manner, this sinusoidal cycle will be actualized with various min and max esteem to decide the impact on split inception time. In Figure 9a, the initiation time of delamination versus loading relative humidity percent at one cycle/day is shown at 20°C. Regarding the figure, it can be seen that the behavior of life-loading is logarithmic. In Figure 9 a, the loading relative humidity percent at one cycle per day is changed from 10% to 50%. As illustrated by the increase of loading relative humidity percent at one cycle per day, the values of initiation time of delamination decrease.
The irreversible Cohesive Zone Model does not require a Paris Law definition (required in direct cyclic fatigue method) is appropriate for both Mode-I and Mode-II fracture problems. The crack growth rate may be augmented in the real condition because of the accumulation of other issues such as chemical damage and temperature change. In Figure 9b, the painting time of crack initialization is shown at various temperatures loading. Total adhesive fracture energy is considered as 250 N/m. By observe on this figure, it can be seen that the behavior of life-loading is logarithmic. Higher the strain rate, the higher the stiffness of the paints, and the higher the temperature, the lower the stiffness. In Figure 9b, the loading temperature at one cycle per day is changed from 10oC to 30oC. As illustrated by the increase of loading temperature difference at one cycle per day, the values of initiation time of delamination decrease. Figure 9 which shows the force magnitude versus crack extension for various thickness and initial length assess the geometrical effects.
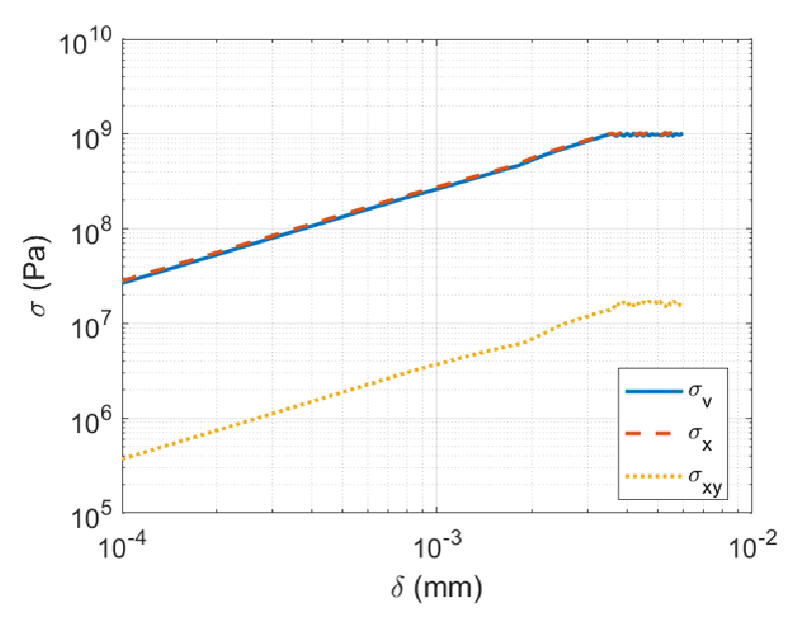
Figure 10 shows the effect of crack length on maximum components of stress in numerical modeling of delamination. As shown the maximum stress happens in normal stress and shear stress is not important in this case. The shear stress in this test is lower than normal stress by two orders of magnitude. As the applied load made the system to bend, the produced stress field is anticipated. As shown normal stress (in beam axial direction) is in order of von misses stress.
Conclusion
In this research, by use of the irreversible cohesive zone model, the effect of temperature and relative humidity cycles on multilayer thin-film paintings is investigated. Tensile and delamination properties of the paints are used for the finite element simulation of the fatigue life prediction model. The homogenous one-dimensional paint layers composed of alkyd and acrylic gesso over a canvas foundation (support) with known constant thicknesses are considered as the mechanical model of painting. Experimental data was used for mathematical modeling of canvas as a linear elastic material and paint as a viscoelastic material with the Prony series. Two types of crack through the length and width of the paint layers are modeled by cyclic mechanical loadings. The three-dimensional modeling of the system is solved by the finite element method in a plane strain formulation. Fatigue damage parameters such as crack initiation time and maximum loads are calculated by an irreversible cohesive zone model under low-cycle fatigue caused by temperature and relative humidity cycles. As shown:
• By increasing of painting system’s thickness, the value of maximum force increases.
• By increasing of painting system’s initial crack length, the value of maximum force increases.
• By increasing loading relative humidity percent at one cycle per day, the values of initiation time of delamination decrease.
• By increasing of loading temperature difference at one cycle per day, the values of initiation time of delamination decrease.
The current paper provides knowledge in a specific field of cultural heritage. It would be enlightening if in further study the possible effect of multiple different layers-composite layers is considered. For example, using a paint layer and varnish layer for sure improves the stress-strain behavior and paint safety.
To continue this research the author suggests making accelerated fatigue delamination by humidity and temperature-controlled chamber. The material age, anisotropic behavior of the canvas, are also other parameters that are neglected in the current paper. Finally, inverse analysis can be employed to optimize the coating design.
- Rice J (1988) Elastic fracture mechanics concepts for interfacial cracks. J Appl Mech 55: 98-103. Link: https://bit.ly/3qFvLm3
- Bank-Sills L, Travitzky N, Ashkenazi D, Eliasi R (1999) A methodology for measuring interface fracture properties of composite materials. Int J Fracture 99: 143-161. Link: https://bit.ly/3qHHUqt
- Charalambides P, Lund J, Evans A, McMeeking R (1989) A test specimen for determining the fracture resistance of bimaterial interfaces. J Appl Mech 56: 77-82. Link: https://bit.ly/30y3d3a
- Tippur HV, Ramaswamy S (1993) Measurement of mixed-mode fracture parameters near cracks in homogeneous and bimaterial beams. Int J Fracture 61: 247-265. Link: https://bit.ly/3CfjRBu
- Slowik V, Kishen JC, Saouma VE (1998) Mixed mode fracture of cementitious bimaterial interfaces: Part I Experimental results. Eng Fract Mech 60: 83-94. Link: https://bit.ly/2YPq49t
- Kotousov A, Berto F, Lazzarin P, Pegorin F (2012) Three dimensional finite element mixed fracture mode under anti-plane loading of a crack. Theor Appl Fract Mec 62: 26-33. Link: https://bit.ly/2YPq7SH
- Kotousov A, Lazzarin P, Berto F, Pook L (2013) Three-dimensional stress states at crack tip induced by shear and anti-plane loading. Eng Fract Mech 108: 65-74. Link: https://bit.ly/3DlL86J
- Pook LP, Campagnolo A, Berto F, Lazzarin P (2015) Coupled fracture mode of a cracked plate under anti-plane loading. Eng Fract Mech 134: 391-403. Link: https://bit.ly/3FBuNLZ
- Červenka J, Kishen JC, Saouma VE (1998) Mixed mode fracture of cementitious bimaterial interfaces: Part II numerical simulation. Eng Fract Mech 60: 95-107. Link: https://bit.ly/3nmMPeg
- Moës N, Belytschko T (2002) Extended finite element method for cohesive crack growth. Eng Fract Mech 69: 813-833. Link: https://bit.ly/3osBCbA
- Yang Z, Deeks A (2007) Fully-automatic modelling of cohesive crack growth using a finite element–scaled boundary finite element coupled method. Eng Fract Mech 74: 2547-2573. Link: https://bit.ly/3HpWUPK
- Dong W, Wu Z, Zhou X (2013) Calculating crack extension resistance of concrete based on a new crack propagation criterion. Constr. Build Mater 38: 879-889. Link: https://bit.ly/3oEErXk
- Wu Z, Rong H, Zheng J, Dong W (2013) Numerical method for mixed-mode I–II crack propagation in concrete. J Eng Mech 139: 1530-1538. Link: https://bit.ly/30sNnpY
- Wang C, Zhu Z, Liu H (2016) On the I–II mixed mode fracture of granite using four‐point bend specimen. Fatigue Fract Eng M 39: 1193-1203. Link: https://bit.ly/3qIBYxE
- Gómez F, Elices M, Berto F, Lazzarin P (2007) Local strain energy to assess the static failure of U-notches in plates under mixed mode loading. Int J Fracture 145: 29-45. Link: https://bit.ly/3FiboiT
- Gómez F, Elices M, Berto F, Lazzarin P (2009) Fracture of U-notched specimens under mixed mode: experimental results and numerical predictions. Eng Fract Mech 76: 236-249. Link: https://bit.ly/3kJqZQJ
- Berto F, Lazzarin P, Gómez F, Elices M (2007) Fracture assessment of U-notches under mixed mode loading: two procedures based on the ‘equivalent local mode I’ concept. Int J Fracture 148: 415-433. Link: https://bit.ly/30r0jNo
- Gómez F, Elices M, Berto F, Lazzarin P (2009) Fracture of V-notched specimens under mixed mode (I+ II) loading in brittle materials. Int J Fracture 159: 121-135. Link: https://bit.ly/3qFw6oP
- Lazzarin P, Berto F, Elices M, Gómez J (2009) Brittle failures from U‐ and V‐notches in mode I and mixed I + II mode: a synthesis based on the strain energy density averaged on finite‐size volumes. Fatigue Fract Eng M 32: 671-684. Link: https://bit.ly/3FmsSL6
- Mu F, Vandenbossche J (2016) A superimposed cohesive zone model for investigating the fracture properties of concrete-asphalt interface debonding. Fatigue Fract Eng M 40: 496-511. Link: https://bit.ly/320xtnD
- Xu S, Reinhardt H (1999) Determination of double-K criterion for crack propagation in quasi-brittle fracture: Part I Experimental investigation of crack propagation. Int J Fracture 98: 179-193. Link: https://bit.ly/3DnPdav
- Xu S, Reinhardt H (1999) Determination of double-K criterion for crack propagation in quasi-brittle fracture: Part II Analytical evaluating and practical measuring methods for three-point bending notched beams. Int J Fracture 98: 151-177. Link: https://bit.ly/3HrcRFp
- Nagashima T, Omoto Y, Tani S (2003) Stress intensity factor analysis of interface cracks using X‐FEM. Int J Numer Meth Eng 56: 1151-1173. Link: https://bit.ly/3kJxcMi
- Dong W, Wu Z, Zhou X (2016) Fracture mechanisms of rock-concrete interface: experimental and numerical. J Eng Mech 04016040. Link: https://bit.ly/3nkxLOz
- RILEM Determination of the fracture energy of mortar and concrete by means of three-point bend tests on notched beams (1985). Mater Struct 18: 285-290.
- Dong W, Zhang L, Wu Z (2014) Experiment study on tension softening constitutive relation of rock-concrete interface. J Hydraul Eng 45: 712-719. Link: https://bit.ly/3DqDkAv
- Camanho PP, Davila CG, De Moura MF (2003) Numerical Simulation of Mixedmode Progressive Delamination in Composite Materials. Journal of Composite Materials 37: 1415–1438. Link: https://bit.ly/3FjokoD
- Reeder JR, Crews JR (1990) Mixed-mode bending method for delamination testing. AAA Journal 28: 1270–1276. Link: https://bit.ly/3nlESpQ
- Hagan EWS, Charalambides MN, Young CRT, Learner TJS, Hackney S (2009) Tensile properties of latex paint films with TiO2 pigment. J Mech Time-Dependent Mater 13: 149-161. Link: https://bit.ly/3oBaYNI
- Tantideeravit S, Charalambides MN, Balint DS, Young CRT (2013) Prediction of delamination in multilayer artist paints under low amplitude fatigue loading, Engineering Fracture Mechanics, Elsevier Ltd 112-113: 41-57. Link: https://bit.ly/30tXADg
- Enderle HF, Kilian HG (1987) General deformation modes of a van der Waals network. Prog Colloid Polym Sci 75: 55-61. Link: https://bit.ly/3kHKlWi
- Marion MF (2007) Determining the acceptable ranges of relative humidity and temperature in museums and galleries: Part 1, Structural Response to Relative Humidity, Smithsonian Museum Conservation Institute 1-57. Link: https://s.si.edu/3niWSRB
- Keck S (1969) Mechanical Alteration of the Paint Film. Studies in Conservation 14: 9-30. Link: https://bit.ly/30uLSb6
- Young CRT (2006) Interfacial Interaction of Modern Paint Layers, Modern Paints Uncovered Symposium, London, UK 247-25.
- Ning J, Liang SY (2019) Inverse identification of Johnson-Cook material constants based on modified chip formation model and iterative gradient search using temperature and force measurements. Int J Adv Manuf Technol 102: 2865-2876. Link: https://bit.ly/3Fj8ydo
- Ning J, Nguyen V, Huang Y, Karl T, Hartwig Steven Y. Liang (2018) Inverse determination of Johnson–Cook model constants of ultra-fine-grained titanium based on chip formation model and iterative gradient search. Int J Adv Manuf Technol 99: 1131-1140. Link: https://bit.ly/3wPpSUe
- Jamalabadi MYA (2016) Thermal Radiation Effects on Creep Behavior of the Turbine Blade, Multidiscipline Modeling in Materials and Structures 12: 291-314. Link: https://bit.ly/3DnevWc
- Benzeggagh ML, Kenane M (1996) Measurement of mixed-mode delamination fracture toughness of unidirectional glass/epoxy composites with mixed-mode bending apparatus. Compos Sci Technol 56: 439-449. Link: https://bit.ly/3wYUkvq
- Camuffo D (2019) Microclimate for Cultural Heritage. Elsevier.
- Abdollahzadeh Jamalabadi MY, Zabari N, Bratasz U (2021) Three-dimensional numerical and experimental study of fracture saturation in panel paintings. Wood Science and Technology 55: 1555–1576. Link: https://bit.ly/3Dnexxi
- Célarié F, Prades S, Bonamy D, Ferrero L, Bouchaud E, et al. (2003) Glass Breaks like Metal, but at the Nanometer Scale. Phys Rev Lett 90: 075504. Link: https://bit.ly/3HuL5aU
- Prades S, Bonamy D, Dalmas D, Bouchaud E, Guillot C (2005) Nano-ductile crack propagation in glasses under stress corrosion: spatiotemporal evolution of damage in the vicinity of the crack tip. Int J Solids Struct 42: 637–645. Link: https://bit.ly/3kCuGHK
- Früh J, Rühm A, Möhwald H, Krastev R, Köhler R (2015) Reflectometry on Curved Interfaces. Phys B 457: 202–211. Link: https://bit.ly/3cm08Fu
- Früh J, Rühm A, Möhwald H, Krastev R, Köhler R (2015) Neutron Reflectometry on samples with curved geometry, Munich.
Article Alerts
Subscribe to our articles alerts and stay tuned.
 This work is licensed under a Creative Commons Attribution 4.0 International License.
 Help ?

PTZ: We're glad you're here. Please click "create a new query" if you are a new visitor to our website and need further information from us.
If you are already a member of our network and need to keep track of any developments regarding a question you have already submitted, click "take me to my Query."

 Save to Mendeley