Annals of Mathematics and Physics
The fractal analysis - Powerful tool for geodynamic investigations
Boyko Ranguelov*
Cite this as
Ranguelov B (2023) The fractal analysis - Powerful tool for geodynamic investigations. Ann Math Phys 6(1): 058-062. DOI: 10.17352/amp.000079Copyright Licence
© 2023 Ranguelov B. This is an open-access article distributed under the terms of the Creative Commons Attribution License, which permits unrestricted use, distribution, and reproduction in any medium, provided the original author and source are credited.Introduction
This is a short review of fractal analysis applications in Bulgaria to investigate the geodynamics at the local, regional, and global levels.
The purpose of this paper is to summarize and presents the achievements in the field of fractal analysis applied at the global, regional, and local level considering different aspects of such research development in Bulgaria. It tries to solve the problems that appeared in the different fields of geodynamics and to obtain new (if possible) results with practical applications. The advantages of the different existing methods are easy calculations, the use of a simple unified parameter such as a fractal dimension, and a new side view to the interpretation of geodynamics.
Of course, as with any other method, the fractal analysis explored in this paper has some disadvantages such as simplification of the used data and information, which leads to less accurate results especially from 3D to 2D transformation of the real natural subjects. Such transformation obligatory represents the idealization of the investigated objects. For example, linear elements are approximating different real boundaries – Earth’s faults, block sides, rift zones, etc. Surface elements are approximating sizes of plates, blocks, subduction zones, etc. It is important to mention that the presented results are a summary of many papers and investigations done earlier by the author and co-authors. The details of several illustrative examples could be found following the respective references.
Separate parts of seismotectonic, recent faulting analysis, isolated tsunami research applications in the Black Sea, morpho structures and relationships with some natural geophysical fields at the regional level, seismic hazard assessment in the Mediterranean, and Plate tectonics at the global level are integrated, and interpreted just to show that fractals can be discovered in all the investigated objects and fractal analysis used as a side view to the well-established and explored methodologies in the geodynamics.
Definitions and counting methods
The classical example of a fractal object is defined by [1]. If the length of an object P is related to the measuring unit length L by the formula:
P ~ L1−D (1)
Then P is a fractal and D is a parameter defined as the fractal dimension. This definition was given by B. Mandelbrot in the early 60-s of the 20th century. His ideas support the view that many objects in nature cannot be described by simple geometric forms and linear dimensions, but they have different levels of geometric fragmentation. It is expressed in the irregularities of the different scales (sizes) – from very small to quite big ones. This makes the measuring unit an extremely important parameter because measuring the length, the surface or the volume of irregular geometric bodies could be obtained so that the measured size could vary from hundred to thousand orders. This fact was first determined when measuring the coastal line length of West England and this gave Mandelbrot the idea to define the concept of a fractal.
In geology and geophysics is accepted that definition of the different «fractals» as real physical objects is most often connected to fragmentation [2]. This reveals that each measurable object has a length, surface, or volume, which depends on the measuring unit and the object’s form (shape) irregularity. The smaller the measuring unit is, the bigger the total value for the linear (surface, volume) dimension of the object and vice versa. The same is valid for 2D and 3D objects. Another definition of a fractal dimension is related to the serial number of measurement to each of the measuring units used and the object dimensions. If the number of the concrete measurement with a selected linear unit is bigger than r, then it might be presented by:
N ~ r−D (2)
and the fractal is completely determined by D as its characteristic fractal dimension [1]. If L is the measuring unit and with m we denote the obtained value for N at each measuring cycle, then the common sum of the lengths N at level m is according to [3]:
Nm = (1-pc) {1 + (n/m)pc + [(n/m)pc]2…[(n/m)pc]m} (3)
where pc denotes the probability measuring of each length for the corresponding cycle of the measurement.
Using formulas (1) and (2) we obtain the following formulas:
Nm+1/Nm= 2D (4)
for liner elements and
Nm+1/Nm = (22)D (5)
for any areal elements (surfaces).
These simple statistical methods are easy to perform, just counting the numbers and presenting them in a coordinate system: on abscise (in semi-logarithmic scale) - numbers of determined intervals of lengths, surfaces, or volumes and on ordinate – just numbers presenting the respective lengths, surfaces or volumes. (see the graphics that follow). During the modern digital era, these algorithms are transformed in the respective software and have widely used names such as the „Box-counting” method, „Variogram” method, „Number-area” approach, Anti-aliasing algorithm for fractal dimension estimation, etc. (more summarized information about these methods could be found in [4]. The physical meaning of the fractal dimension to our investigated cases is generally used as a measure of the fragmentation (more frequently) and/or as a filter in some other issues (for example. tsunami-prone areas in the Black Sea).
Practical applications and results
The presented examples just show the applicability at different levels: The fractal theory and analysis are very frequently used in many fields of geophysics, describing the fragmentation of geology objects as cracks, grains of magmatic rocks, the chemical composition of minerals, etc. In geophysics, especially fractal analysis has valuable weighs in seismicity approximations as points of epicenters, lines of seismic lineaments, clusters of aftershocks, etc [2,5].
The published applications of fractals in geodynamics are surprisingly low. Just a few papers present some results considering the spatial distribution of subduction zones [2] and sizes of the plates in the model of Bird [6].
Global level
Fractal properties of the plate tectonics: The graphical fractal analysis has been performed after the separation of the major elements of the Plate tectonics theory - tectonic plates, orogens, rift zones, transform faults, subduction zones, etc. using the internationally recognized model by Bird [6].
The statistics are as follows:
- Tectonic Plates: total number – 52; investigated parameter –“area size”.
- Rift Zones: total number - 14; investigated parameter – “lengths”.
- Orogens: total number - 13; investigated parameter – “area size”.
- Subduction Zones: total number - 18; investigated parameter – “area size”.
- Major Collision Zones: number – 18; investigated parameter- “area size”.
- Major Transform Faults - number - 18; investigated parameter “lengths”.
The details of this study are available at [7]. It is important to mention in advance that in geodynamics there is no self-affinity between each level and it is due to the exploration of the very different in their physical properties parameters investigated under a similar approach. For example, the surface earth’s cracks in the magmatic rocks due to external factors (erosion, etc.) are not compatible with the fragmentation of the continental plate boundaries (due to internal factors like deep convective mantle cells).
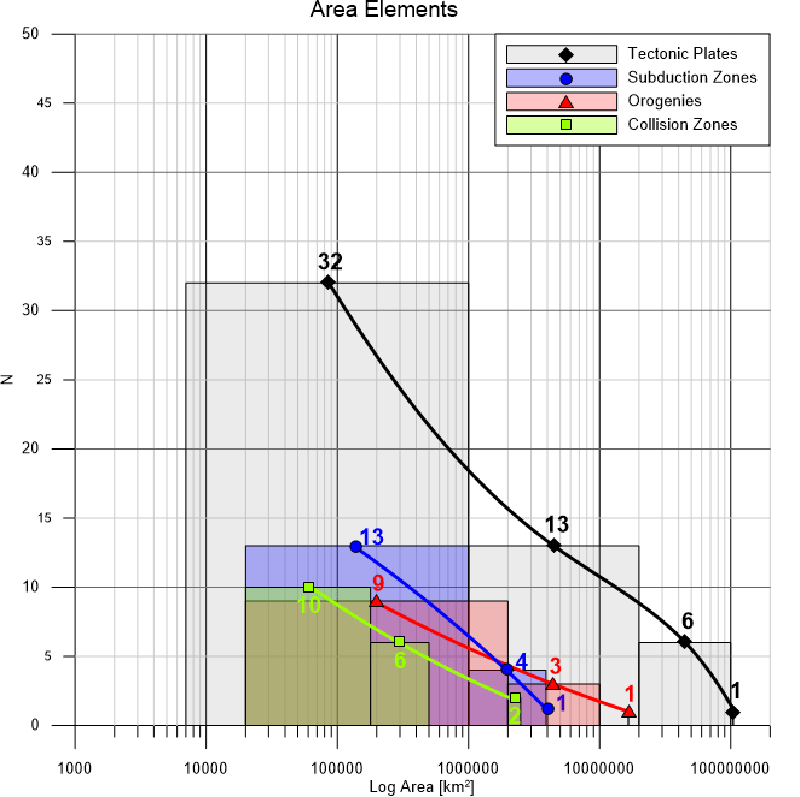
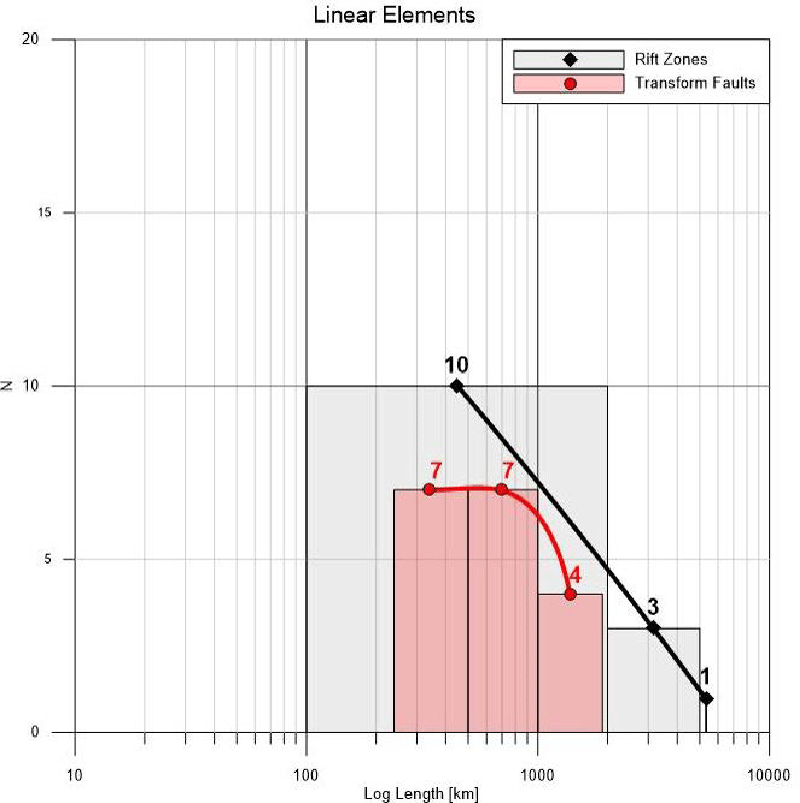
Figures 1,2 display obtained fractal graphics for areal elements of the Plate tectonics (Figure 1) and linear elements (Figure 2). They represent graphically the comparison of the sizes and lengths of the investigated geodynamic elements, as well as their fractal dimensions. It is clearly visible that the areal elements have different fractality (Figure 1) than the linear ones (Figure 2). Something more: Figure 2, represents the rift zones as a clear fractal, but the transform faults – are not the same case. They are not presentable as fractals. This needs additional research to clarify this uncertainty.
Regional level
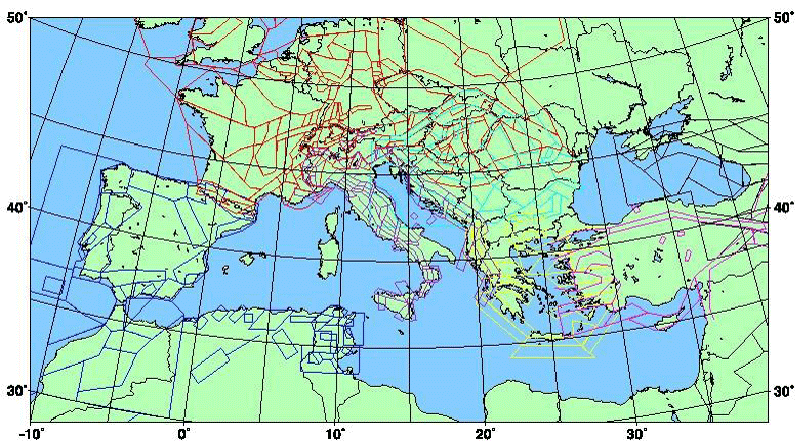
Euro-Mediterranean seismotectonic model and its fractality: The study is focused also on the estimation of the fractal properties and coefficients of the seismogenic zones in the Mediterranean Region. The area is divided into several seismotectonic provinces in accordance with the corresponding fragmentation and the specific seismogenic properties of the Earth's crust for the separate zones. The Mediterranean Seismotectonic Model (MSM) is presented by M. Jimenez, et al. [8].
We have determined the number and the size of all lines delineating each of the surface elements of the model, as well as the size of the areas covered by each polygon. The authors of the map have divided the region into several seismotectonic provinces (we follow their denoting) Figure 3, Table 1:
– The Adriatic (AD)
– Central and West Europe (CWE)
– The Pyrenees and West Africa (PWA)
– Greece (GR)
– Bulgaria and the Northern Balkans (BG NB).
The existence of clearly defined non-linear features of the seismic hazard distribution reveals that the knowledge and the practical assessment of seismic hazard distribution cannot be described by simple elementary relations. It is clear that more punctual and refined methods of fractal analysis can help significantly if the formal presentation of geometrical objects is more closely related to the faults’ systems and other generators of seismicity.
The details of this study can be found in [9].
Local level
A similar approach was performed to the local seismotectonic model of the Balkan Peninsula. The same results have been obtained [10]. Much more effective is to relate the earth's crust fragmentation with its seismogenic properties. The fractal properties of the model of earth’s crust fragmentation of recent quaternary faults have been investigated in [11].
Similar results supported the idea of fractal analysis as a powerful tool for recent geodynamics and seismotectonics. Then the applications go on further to the specific case of fractal distribution of aftershocks sequences of the Kefalonia earthquake revealed in [5].
Much more interesting is the local application for the tsunami study in the Black Sea.
The Black Sea fractal dimensions – geometry and scaling
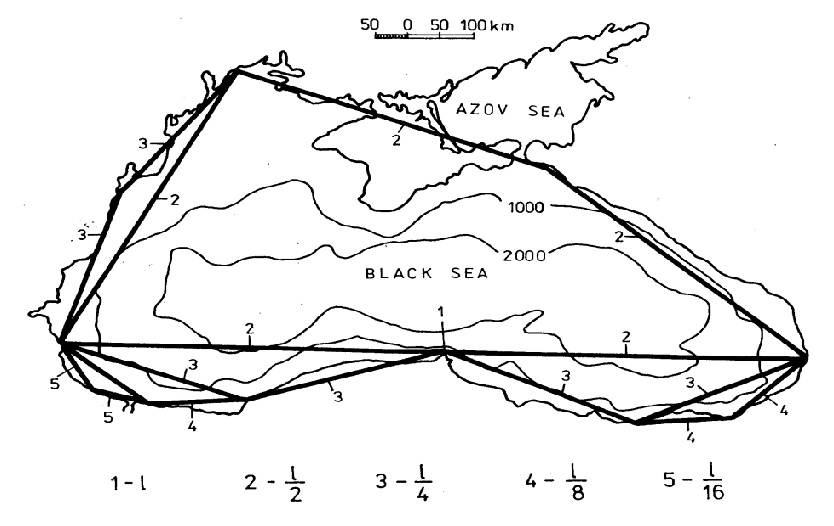
Our investigations have been done as regards the coastline of the Black Sea and the 1000 and 2000 isobaths in the same sea [12]. Having in mind that all lengths under investigation have been established by interpolation procedures, we believe that some deviations due to uncertainties are acceptable. The significant lengths are in the ranges of tens to hundred of meters for the low limitation boundary and about thousands of kilometers for the upper one. The total range of the measurable lengths is from about 10 to 106 meters approximately.
For the calculations, we used formula (3). The fractal dimension for the coastline is D = 1.200; D = 1.222 is the same for the 1000-meter isobath and D = 1.213 for the 2000 m isobath. Using the digitized maps of different scales we obtained the distributions of the approximated fragmentation, as shown in Figure 4.
The results have been obtained by calculating the total lengths at r-measuring distances, respectively: L = 1000; 500; 100; 50; 25; 10;7.5; 5.0 and 1 kilometer and 100 and 10 meters. Something more - the relation between the different depths levels shows also fractal properties with similar dimensions:
Details are available in Ranguelov [12].
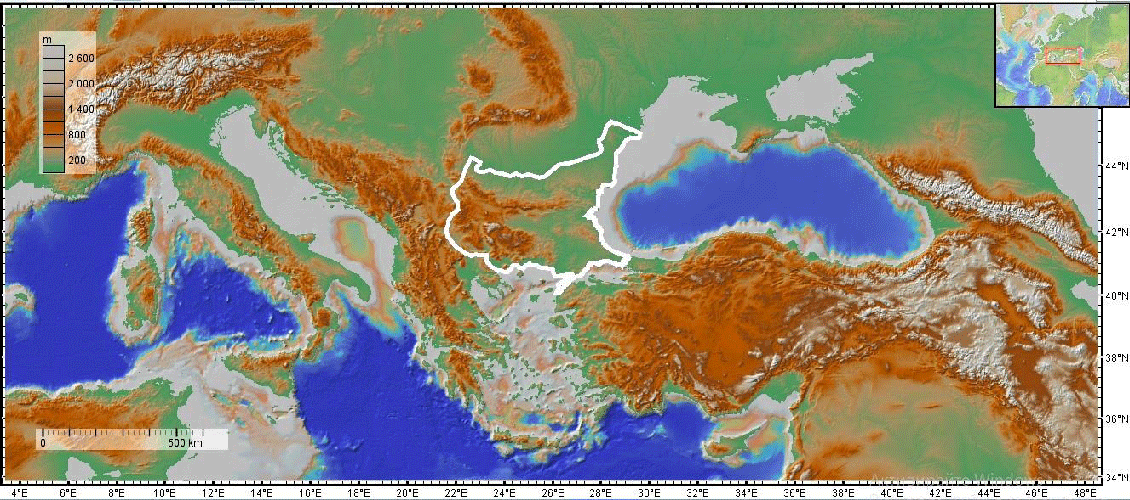
Finally, a study of the topography heterogeneity within the Eastern Balkans using DEM and fractal dimension shows one more practical application Figure 5, Table 2.
The numbers demonstrate the possibilities of the fractal approach in the analysis and interpretation of regional gravity fields in the eastern part of the Balkan Peninsula. The results obtained confirmed the complexity of contemporary morphotectonic processes operating in the region on the one hand and the heterogeneous origin of the Earth's crust on the other.
This study provides a good starting point for future comparative analyses with similarly neighboring regions. Fractals could play a key role in this and would contribute to a better understanding of the processes and phenomena in the Earth's crust and upper mantle dynamics of the Eastern Mediterranean.
More detailed analyses could be obtained in [13,14].
Conclusion
All presented illustrations of the fractal analysis applications at the global, regional, and local levels confirmed the fractal properties of the investigated objects. Something more, the results obtained show the heuristic role of the preformed approach. The wide spectrum of problems could be investigated using a simple methodology of fractal analysis. The side view of the well-established and frequently used procedures and methodologies in geodynamics could be richer and more effective by the methods of fractal analysis giving a new insight view to the recent processes of geodynamics.
- Mandelbrot B. The Fractal Geometry of Nature. San Francisco: W.H. Freeman & Co., San Francisco. 1982; 68.
- Korvin G. Fractal models in the Earth Sciences. New York: Elsevier. 1992; 236.
- Turcotte D. Fractals and fragmentation. Journal of Geophysical Research. 1986; 91: 1921-1926.
- Ranguelov B, Lliev R. Fractal Universe: A case study of Solar System. LAP Lambert Academic Publishing., Riga. 2019; 122.
- Gospodinov D, Stoychev D, Ranguelov B. Studying the Spatial Evolution of a Fractal Set of Points; Application on the 1983 Kefalonia Aftershock Sequence, Greece. Journal of Physics and Technology. 2016; 29-32.
- Bird P. An updated digital model of plate boundaries. Geochemistry, Geophysics, Geosystems G3. AGU and the Geochemical Society. 2003; 4:1027-1079.
- Ranguelov B, Ivanov Y. Fractal properties of the elements of Plate Tectonics. Journal of Mining and Geological Sciences. PART I Geology and Geophysics. 2017; 83-89.
- Jimenez M, Giardini D, Grunthal G. Seasame Working group. Unified seismic hazard modeling throughout the Mediterranean region, Bolletino di Geofisica Teorica ed Applicata. 2001; 42; 3-18.
- Ranguelov B. Nonlinearities and fractal properties of the European-Mediterranean seismotectonic model. Geodynamics & Tectonophysics. 2010; 225-230.
- Ranguelov B, Dimitrova S, Gospodinov D. Fractal configuration of the Balkan seismotectonic model for seismic hazard assessment. Proc. BPU-5, Vrnjacka Banja, Serbia and Montenegro. 2003; 1377-1380.
- Ranguelov B, Dimitrova S. Fractal model of the recent surface earth crust fragmentation in Bulgaria. Compt Rend Acad Sci. 2002; 55: 25-28.
- Ranguelov B. Fractal dimensions and tsunami run-ups in the Black Sea. Compt Rend de’lAcad. Sci. 1997; 50:47-50.
- Tzankov TZ, Iliev R, Ranguelov B. Fractal structure of the positive free-air gravity anomalies within the Balkan Peninsula. Physics Journal. 2018; 225-233. http://purkh.com/index.php/tophy.
- Lliev R, Ranguelov B. Survey of the topography heterogeneity within the Easterh Balkans using DEM and fractal dimension. J of Socio Brains. 2021; 37-42.
Article Alerts
Subscribe to our articles alerts and stay tuned.
 This work is licensed under a Creative Commons Attribution 4.0 International License.
 Help ?

PTZ: We're glad you're here. Please click "create a new query" if you are a new visitor to our website and need further information from us.
If you are already a member of our network and need to keep track of any developments regarding a question you have already submitted, click "take me to my Query."


 Save to Mendeley