Annals of Mathematics and Physics
Comparison of the performances between the gray and non-gray media approaches of thermal transport in silicon-tin
C Iheduru1,3*, MA Eleruja1, B Olofinjana1, OE Awe1,2 and ADA Buba3
2Department of Physics, University of Ibadan, Ibadan, 200284, Nigeria
3Department of Physics, University of Abuja, Abuja, 900105, Nigeria
Cite this as
Iheduru C, Eleruja MA, Olofinjana B, Awe OE, Buba ADA (2023) Comparison of the performances between the gray and non-gray media approaches of thermal transport in silicon-tin. Ann Math Phys 6(1): 089-092. DOI: 10.17352/amp.000085Copyright Licence
© 2023 Iheduru C, et al. This is an open-access article distributed under the terms of the Creative Commons Attribution License, which permits unrestricted use, distribution, and reproduction in any medium, provided the original author and source are credited.We have compared the performances of the gray and non–gray media approaches of thermal transport in Silicon – Tin using Monte Carlo Simulation. The Boltzmann Transport Equation (BTE) for phonons was used to describe the heat flow and ballistic conduction in semiconducting alloy systems. In this work, we have attempted solving the BTE using Monte Carlo (MC) simulation Computational domains for both gray and non-gray media approaches are modeled and the geometry and dimensions of unit cell and sub-cells in the domain are determined. In addition, the computational performances of the gray and non-gray media approaches are compared. The results revealed that when compared to non- gray approach, the gray media approach has more errors in the sub-cells. The maximum relative error is about 3.5%. The results also show that the non–gray media approach of thermal transport in Silicon – Tin exhibited numerical predictions with a very close match to experimental data.
Introduction
The Lattice-Boltzmann Equation Model (LBM) known as the non–gray model is a discrete development [1] of the BTE, which can be used to simulate energy transport problems within the applicability range of the BTE. Recent efforts in LBM implementation have been based on the Debye model, resulting in what has been called the gray LBM [1]. These efforts have been geared towards advancing a model that offers accurate numerical predictions of simulations of thermal transport in semiconducting alloys. However, many works basically use only one of the models for the simulation of thermal transport and so, there are very few studies that compare the performances of both the gray and non–gray media approaches to studying thermal transport in Silicon – Tin.
The gray media approach considers a linear dispersion relation, from which only a single frequency-independent phonon propagation speed can be computed. The non–gray media on the other hand takes into account frequency and polarization phonon propagation and two kinds of scattering events; elastic and inelastic. Elastic scatterings such as impurity scattering only cause changes in the flight direction without affecting the phonon properties such as frequency and polarization whereas inelastic scattering processes such as three phonon scattering (both Umklapp and Normal) influence flight direction as well as phonon properties [2-4].
In this paper, we intend to compare the performances of the gray and non–gray media approach of thermal transport in silicon-tin (Si1-xSnx) using Monte Carlo simulation with a view to enhancing each model approach for the Monte Carlo simulation of semiconductor alloys.
Theory and computational methods
The Boltzmann Transport Equation is the most preferred method suitable for the Monte Carlo simulation of thermal conduction in SiSn semiconductor alloy [4]. Hence the Boltzmann Transport Equation (BTE) has been widely used to describe the phonon transport in nano-sized crystalline solids [5]. It is assumed that phonons follow Bose-Einstein statistics and interact with each other via scattering processes. The BTE is expressed as,
Where f is the distribution function of an ensemble of phonons, v(g) is the group velocity, and [(df)/(dt)] is the rate of change of f due to scattering. Ñf is the distribution function.
The Left-Hand Side (LHS) of the above equation represents the change in the distribution function due to the phonon drift and the Right-Hand Side (RHS) represents the change in the distribution function due to various scattering mechanisms. The distribution function is a complex function of seven independent variables - three spatial coordinates, three wave vectors, and time [4].
Sampling of phonon gray model
For a gray model, one only considers a single relaxation time for all the scattering processes (elastic as well as inelastic) which is expressed as follows:
where Ʌ is the mean free path of a phonon and Vavg is the phonon average velocity. Average phonon frequency and average group velocity are computed based on the local cell temperatures and are assigned to the phonons being emitted from that particular cell. As the contribution of optical phonons towards the thermal conductivity of a nanocomposite structure is very less compared to the acoustic phonons [2-4], only the three acoustic polarization branches are considered in the simulation model.
Monte Carlo simulation of thermal transport in SiSn using gray media approach
The thermal conductivity variation of bulk Sn as a function of the temperature above 100 K using the gray media approach was computed using the Monte Carlo simulation package in Geant4. The thermal conductivity of Sn has been determined by computing the heat flux across a domain for a given thermal gradient. The heat flow was determined by counting the number of phonons crossing a reference plane in a given time step and multiplying them with the weighing factor decided before the start of the simulation in the gray model.
A thermal gradient of 10 K was applied for calculating the thermal conductivity at each temperature. Theoretical bulk Sn values were calculated from the linear power regression of theoretical data in the temperature range of 100K ≤ T ≤ 600K as described by Lacroix, et al. [6].
The simulations were performed on 4µm thick samples so that the mean free path of the phonons in the temperature range selected was much more than the domain size. That is, the thermal transport is in the ballistic regime which represents the scenario of bulk Sn.
Sampling of phonon non-gray model
For the non-gray model, different relaxation times based on the type of scattering process experienced by a phonon are considered. If are the relaxation times for impurity, Umklapp, and Normal scattering processes respectively, and τ is the total relaxation time; then according to Matthiessen’s rule [7].
This rule gives the total relaxation time which would be required in the subsequent calculations.
Monte Carlo simulation of thermal transport in SiSn using non-gray media approach
In the non-gray media approach, the temperature is not the only variable, hence, at the nano-scale, the thermal conductivity of materials becomes less than their bulk counterparts due to the boundary scattering. Boundary scattering was defined by a specularity parameter, s (ranging between 0 and 1 where 0 is a diffuse boundary and 1 is a specular boundary), which determines whether a phonon hitting a lateral surface will be specularly or diffusively reflected back. The implementation of this boundary scattering in Monte Carlo simulation is straightforward. When a phonon reaches a lateral boundary a random number is selected and compared to s. If the random number is less than s, the phonon is reflected specularly without any change in the magnitude of direction vectors. If the random number is greater than s, the magnitude of the direction vector will be reset and the phonon is reflected back into the domain. The thermal conductivity of Sn at 300 K is simulated for various domain sizes ranging from 10 nm to 60 nm. The simulation procedure ends when the 1000 time steps are reached.
Results and discussion
Thermal transport in nanocomposites using gray media approach
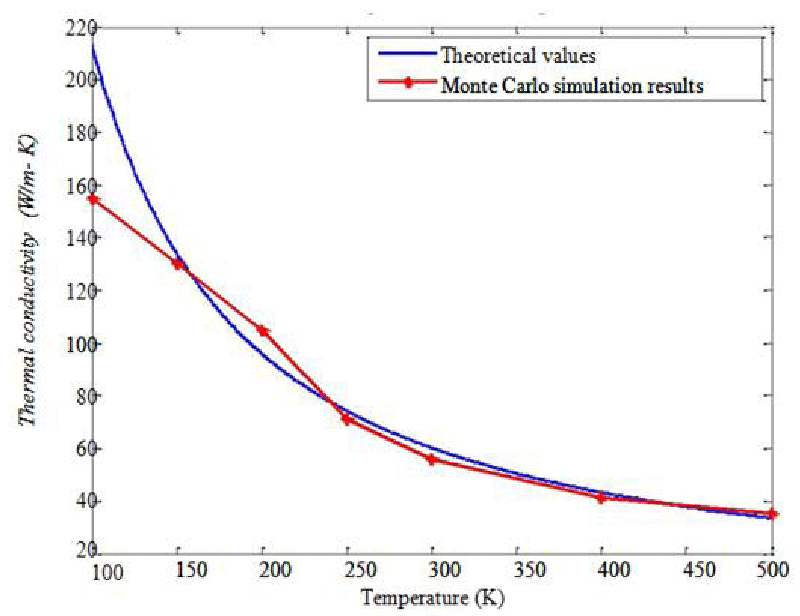
Figure 1 shows the thermal conductivity variation of bulk Sn. It shows that the Monte Carlo simulation results match well with the theoretical data found by Lacroix, et al. [6]. The deviation of thermal conductivity from the theoretical bulk values below 150 K can be attributed to the material boundary scattering events which were not accounted for in the gray media of the Monte Carlo simulations performed [4,5].
Thermal transport in nanocomposites using non-gray media approach
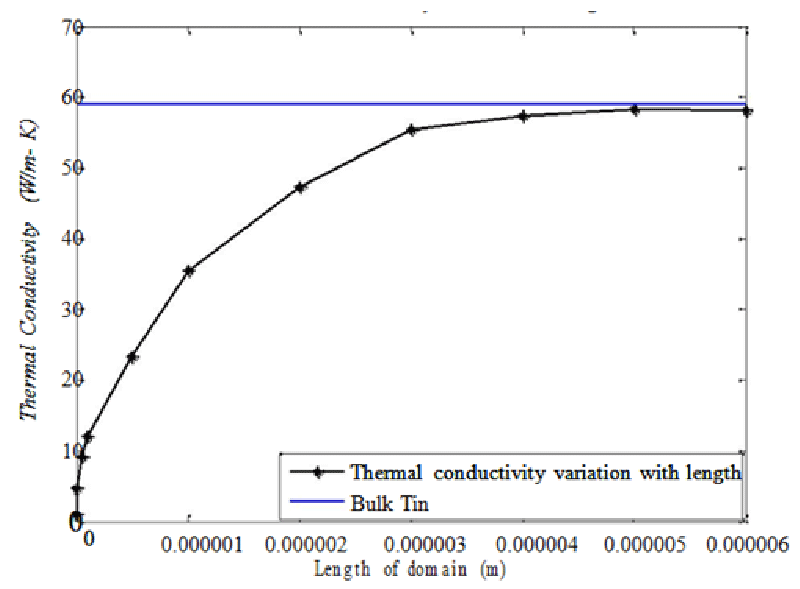
Figure 2 shows the thermal conductivity variation of bulk Sn using non – gray media approach. The result from this work suggests that thermal conductivity at higher domain sizes approaches the bulk value as shown in Figure 2. Heat conduction, in the low-temperature regime, is purely dominated by boundary scattering. The thermal conductivity in this case is arbitrarily large because the phonons impinge on the film boundaries directly and scatter. This is in agreement with the findings of Wong, et al. [8] in their MC simulation for phonon transport.
Comparison between the performances of the gray and non-gray media approaches
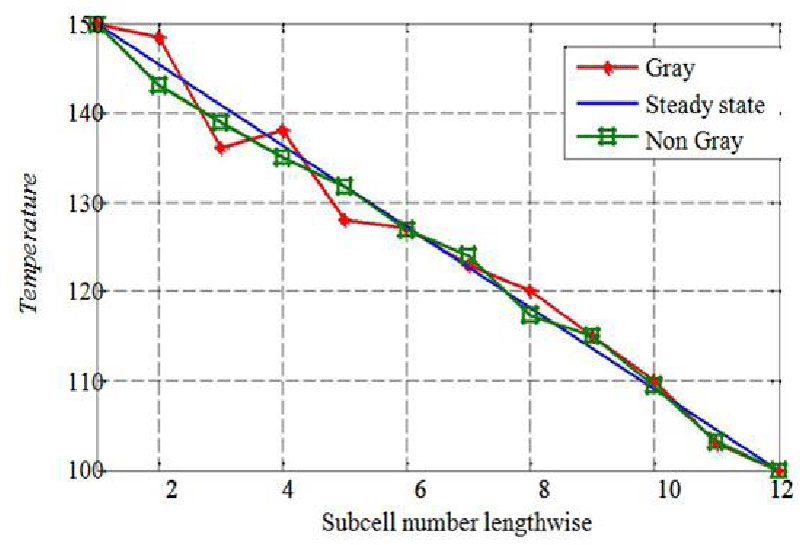
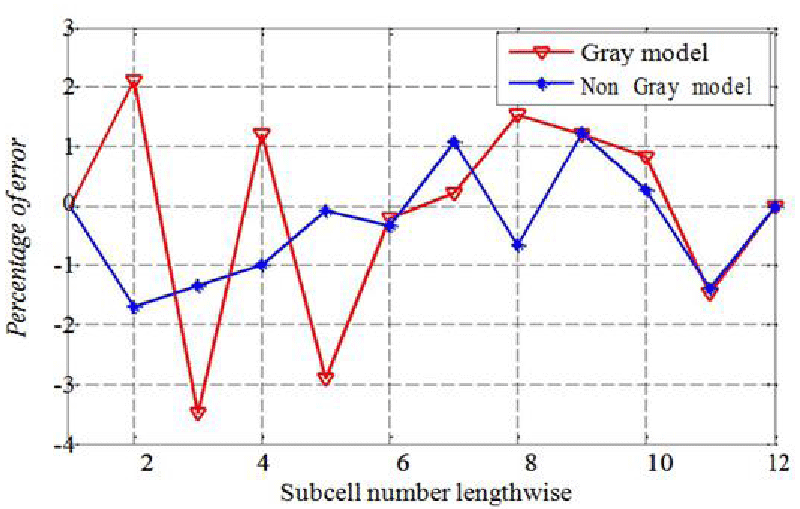
The results using the gray and non-gray media approaches are compared with the left end at 150 K and the right end at 100 K. Figure 3 shows a temperature comparison between gray and non–gray media approaches. Figure 4 shows the comparison between gray and non-gray models in terms of fluctuation error. Phonons in the non-gray media approach belong to well-defined polarization branches which is absent in the gray media approach. Thus the non-gray media approach includes many of the physical aspects involved in heat transfer when compared to the gray media approach. Although both gray and non-gray models are equally efficient, the non-gray approach has smaller fluctuations and better stability as shown in Figure 3 and this agrees with the results in the study carried out by Huang, et al. [9] and Jeng, et al. [2].
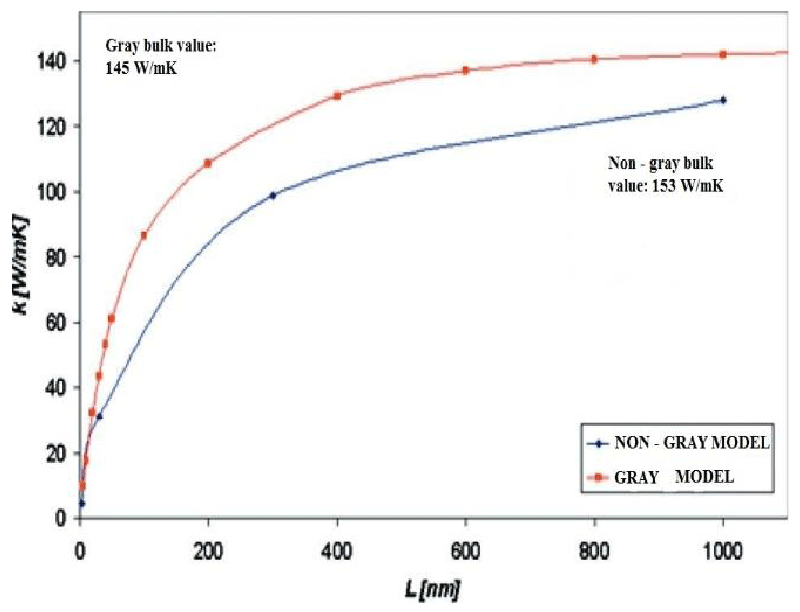
When compared to non- gray approach, the gray media approach has more errors in the sub-cells. The maximum relative error is about 3.5%. It is desirable to decrease the error in the simulations when the temperature difference between the two isothermal boundaries is small [10]. The thickness-dependent effective thermal conductivity values predicted by the non-gray model are consistently lower than those predicted by the gray model for the same film thickness. To analyze the dispersion non-gray capabilities, the results for thermal conductivity as a function of the film thickness of the models based on the steady-state temperature distribution are depicted in Figure 5. Figure 5 depicts a comparison between out-of-plane effective thermal conductivity predictions by the gray and non-gray media approaches. As can be seen, the gray media predicts an effective thermal conductivity value that remains close to the bulk value of 148 W / m K down to a film thickness of 1000 nm. Further decreases in the film thickness cause a slight decrease in the effective thermal conductivity down to a film thickness of approximately 400 nm. For films thinner than 400 nm, the decrease in thermal conductivity is more pronounced and the gray media eventually predicts an effective thermal conductivity value of zero for a film of vanishing thickness.
The non-gray model gives a bulk thermal conductivity value of 153 W / m, which compares well with the value predicted by the gray model, 145 W / m K, and is in good agreement with the experimental value of 148 W / m K [11].
The thickness-dependent effective thermal conductivity predicted by the non–gray model as seen in Figure. 5 is consistently lower than that predicted by the gray model. The above results and models give a better understanding of the gray and non-gray media approaches as it relates to the ballistic conduction of phonon in nano-sized materials. The non-gray model, which includes the effects of nonlinear dispersion relations for all phonon branches, is considered to be more accurate than the gray model due to the improved phonon physics inherently captured by the model, which allows the simulation of multiple discrete phonon frequency bands and the explicit treatment of phonons without simplifying assumptions [12]. This is a considerable improvement from the gray model, which only considers a single phonon mode with a constant propagation speed and is, therefore, unable to capture the behavior of phonon modes characterized by propagation speeds different from the one defined by the non-gray model.
Conclusion
Thermal transport in SiSn nanocomposites was simulated in the ballistic regime between 10 – 300 K using the gray and non-gray media approaches. It was found that the non-gray model, which accounts for dispersion, frequency, and two kinds of scattering events: elastic and inelastic, exhibited numerical predictions with a very close match with experimental data.
The performances of the gray and non–gray models were compared. It was found that the gray model gives reasonably accurate results while the non-gray model provides a more detailed description of the phonon dispersion and scattering and results in smaller approximation errors.
- Succi S. The Lattice-Boltzmann Equation for Fluid Dynamics and Beyond, Clarendon Press, Oxford, UK. 2001.
- Jeng MS. Modeling the Thermal Conductivity and Phonon Transport in Nanoparticle Composites using Monte Carlo Simulation, Journal of Heat Transfer. 2008; 130:42410–42415.
- Mazumder S, Majumdar A. Monte Carlo Study of Phonon Transport in Solid Thin Films Including Dispersion and Polarization, Journal of Heat Transfer. 2001; 123:749-759.
- Mittal A, Mazumder S. Monte Carlo Study of Phonon Heat Conduction in Silicon Thin Films Including Contributions of Optical Phonons, Journal of Heat Transfer. 2010;132:052402–052405.
- Zebarjadi M, Shakouri A, Esfarjani K. Monte Carlo Simulation of Electron Transport in Degenerate and Inhomogeneous Semiconductor, Applied Physics Letters. 2007; 90:225 -229.
- Lacroix D, Lemonnier D, Joulain K. Monte Carlo Transient Phonon Transport in Silicon and Germanium at Nanoscales, Physical Review. 2005; 72:64305-64309.
- Murthy JY, Fisher TS. Modelling of Subcontinuum Thermal Transport Across Semiconductor Gas Interfaces, Heat Transfer Summer Conference. 2005; 15:389 -400.
- Wong BT, Francoeur M, Pinar M. A Monte Carlo Simulation for Phonon Transport Within Silicon Structures at Nanoscales with Heat Generation, International Journal of Heat and Mass Transfer. 2011; 54:1825-1838.
- Huang MJ, Kang TY. A Monte-Carlo study of the Phonon Transport in Nanowire-embedded Composites, International Journal of Thermal Sciences. 2011; 50:1156–1163.
- Chen A, Sher A. Semiconductor Alloys Physics and Materials Engineering, Physical Review Letters. 2012; 84:1197-1198.
- Tseng H, Kirsch T, Park C, Bersuker M, Majhi P, Hussain M, Jammy R. Microelectron, Engineering Technology. 2009; 86:1722– 1727
- Hao Q, Chen G, Jeng MS. Frequency-dependent Monte Carlo Simulations of Phonon Transport in Two-dimensional Porous Silicon with Aligned Pores, Journal of Applied Physics. 2009; 106 :114321-114329.
Article Alerts
Subscribe to our articles alerts and stay tuned.
 This work is licensed under a Creative Commons Attribution 4.0 International License.
 Help ?

PTZ: We're glad you're here. Please click "create a new query" if you are a new visitor to our website and need further information from us.
If you are already a member of our network and need to keep track of any developments regarding a question you have already submitted, click "take me to my Query."


 Save to Mendeley